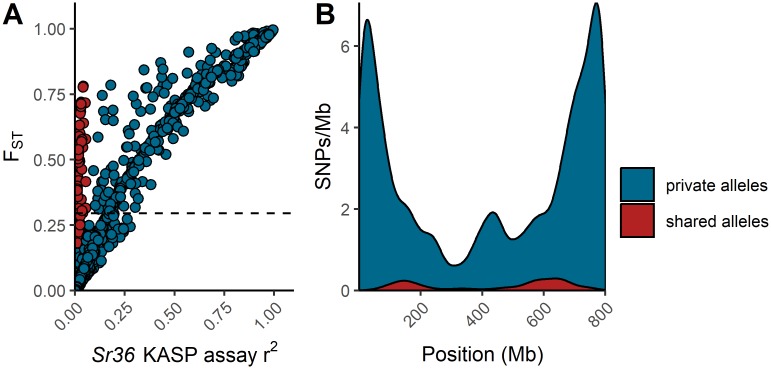
Fig 4. Triticum timopheevi private and shared alleles on chromosome 2B.
(A) FST plotted against r2 with the KASP Sr36 assay for all SNPs on chromosome 2B. Two clusters of SNPs were manually differentiated—those with putative Triticum timopheevi private alleles for which FST and r2 values show a general linear relationship (blue), and those with putative Triticum timopheevi/Triticum aestivum shared alleles for which FST shows no relationship with r2 (red). Horizontal dashed line represents the 99th percentile of genome-wide FST values, excluding SNPs on chromosomes 2A, 2B, and 2D. (B) Density plots of both classes of SNPs across chromosome 2B.

