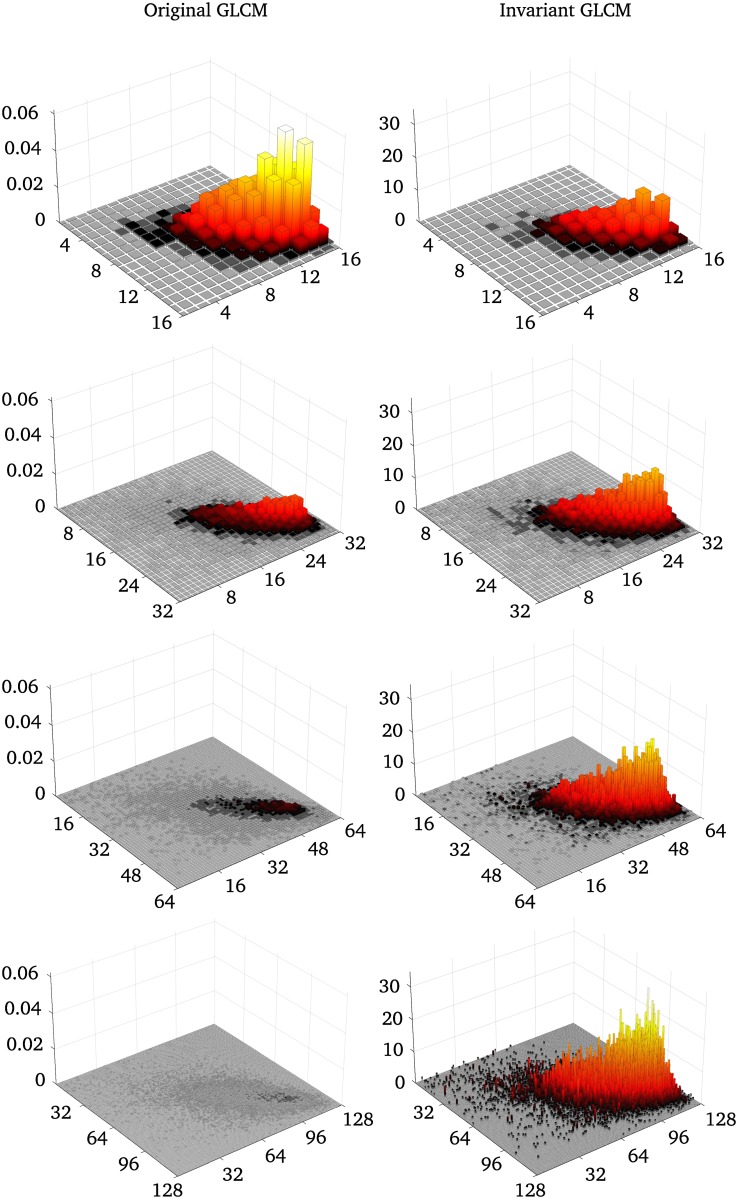
Fig 4. Example of original and invariant GLCMs for different quantization levels from Dataset 1.
The left column shows the original GLCMs created from the cerebellum region in Fig 3, for different quantization levels. The right column shows the invariant GLCMs for the same quantization levels. The original GLCMs are normalized so that the sum is 1, whereas the invariant features are normalized so that the volume of the GLCM is 1.

