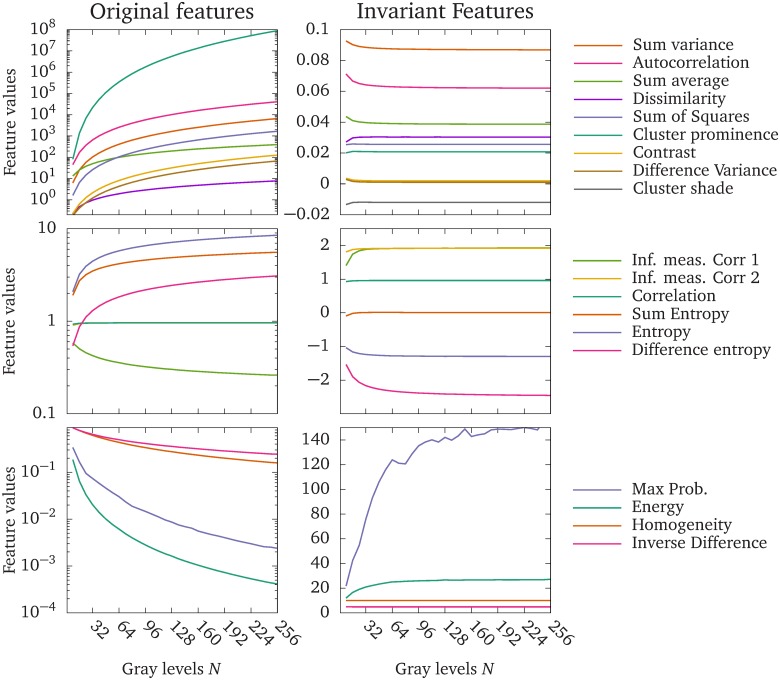
Fig 5. The original Haralick feature values, and the proposed invariant feature values.
Texture feature values computed from a benign glandular structure in the gland dataset. The upper left plot shows the original Haralick features that increase rapidly with the number of gray-levels. The middle left plot shows original Haralick features that increase modestly, or reach a plateau with increasing number of gray-levels. The bottom left plot shows original Haralick features that decrease with increasing number of gray-levels. The right column shows the corresponding invariant features. Note that the original features are plotted on a log-scale to accommodate the wide range of values. The Information measure of Correlation 2 and Correlation overlap in the original features. The Information Measure of Correlation 1 is negative in the original features, but the absolute values are displayed in the graph to accommodate the log scale.

