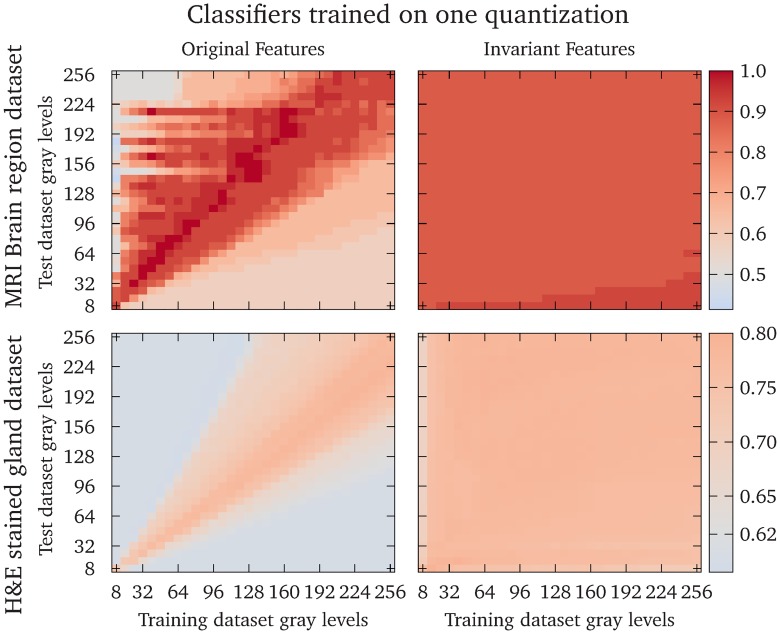
Fig 7. Accuracy of classifiers trained on one quantization gray-level.
The heatmaps show the accuracy of logistic regression models trained on one quantization gray-level and tested on all quantization gray-levels in the range 8–256 in steps of 8. The colormap is scaled to show a neutral gray for the accuracy obtained by assigning all predictions to the most common class, which is 0.5 for either the cerebellum or prefrontal cortex in Dataset 1 and 0.615 for benign glandular structures in Dataset 2. The upper row shows the result from Dataset 1 and the lower row shows the results from Dataset 2. The left column shows the original features and the right column shows the invariant features. The diagonal elements show the accuracies where the same quantization gray-levels were used for the training and test data.

