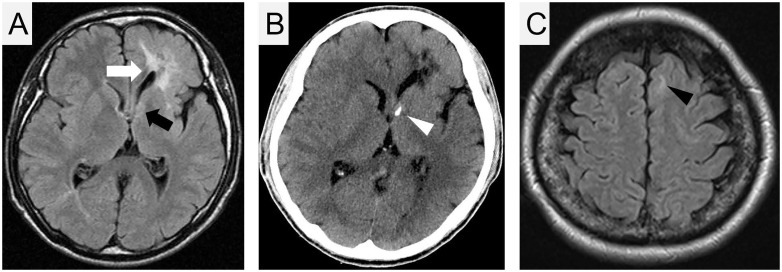
Fig 3. Brain imaging.
Axial magnetic resonance imaging (MRI; T2 fluid-attenuated inversion recovery) (A) and computed tomography (CT) imaging (B) of patient 3. The high-intensity area near the left lateral ventricle represents cortical dysplasia (tubers and radial migration lines; white arrow). The high-intensity area, which was observed in MRI (black arrow) with calcification in CT (white arrowhead) near the left Monro foramen, represents a subependymal nodule. (C) MRI (T2 fluid-attenuated inversion recovery) of patient 1. The high-intensity area in the left frontal lobe represents a cortical tuber (black arrowhead).

