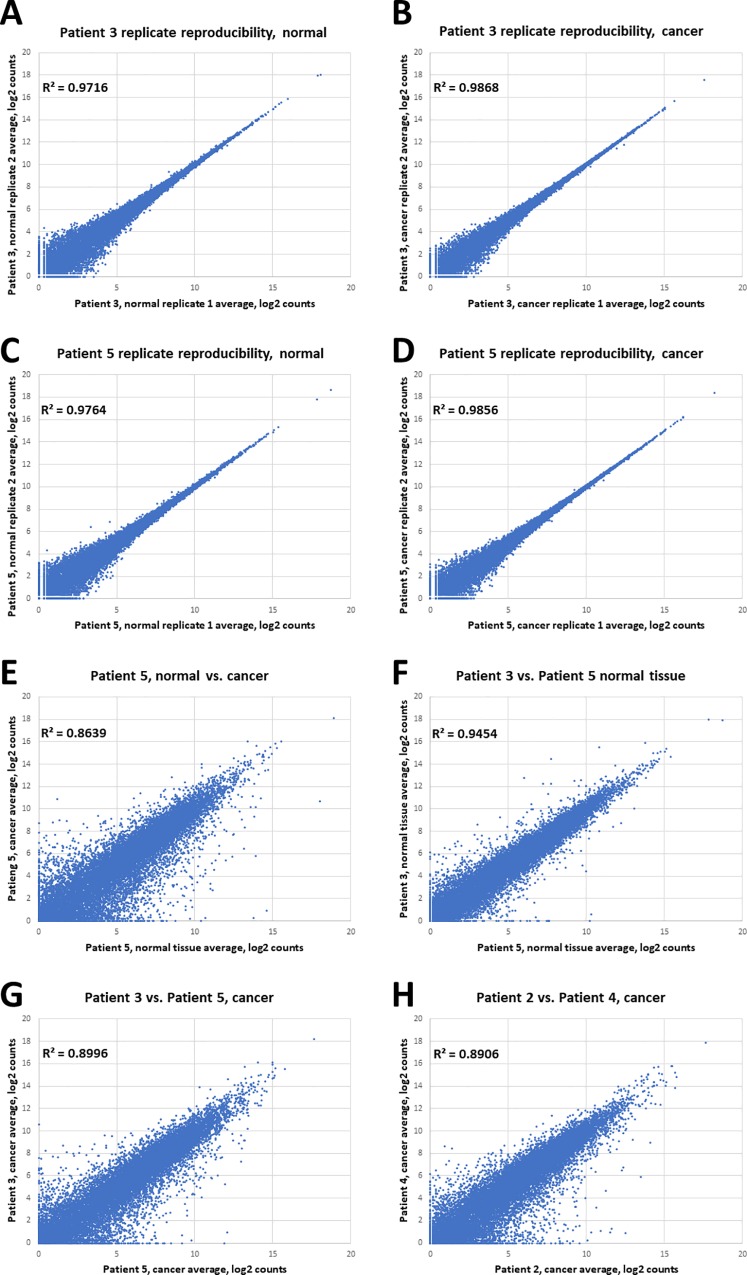
Fig 4. Expression variability in matched cancer vs. normal tissue.
Reproducibility of within-donor biological replicates (average of three technical replicates each) of (A) normal FFPE samples, patient 3 (brown symbols in Fig 3 PCA plot), (B) cancer FFPE samples, patient 3, (C) normal FFPE samples, patient 5 (purple symbols in the Fig 3 PCA plot), and (D) cancer FFPE samples, patient 5. (E) Comparison of normal and cancer samples from one patient (average of two biological replicates each). (F) Comparison of normal tissue between patients 3 and 5 (largest difference in normal tissue expression profiles), showing that differences due to normal gene diversity are far lower than those between cancer and normal. (G) Comparison between cancers of different pairs of patients (Patient 3 vs Patient 5) showing the range of differences. (H) Comparison between cancers of different pairs of patients (Patient 2 vs Patient 4), showing the range of differences that, again, exceeds those seen in normal-to-normal comparison range.

