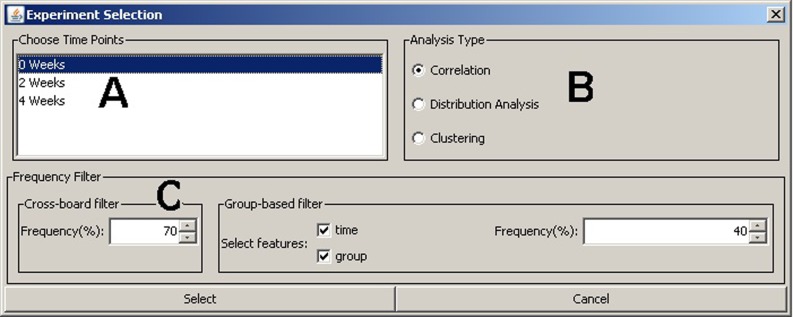
Fig 1. Experiment selection window.
(A) Time points available for this experiment (in our case study we chose all three time points). (B) Analysis type to perform. (C) Molecules (peaks) frequency filter across all samples (cross-board filter) and also per group of selected features (group-based filter).

