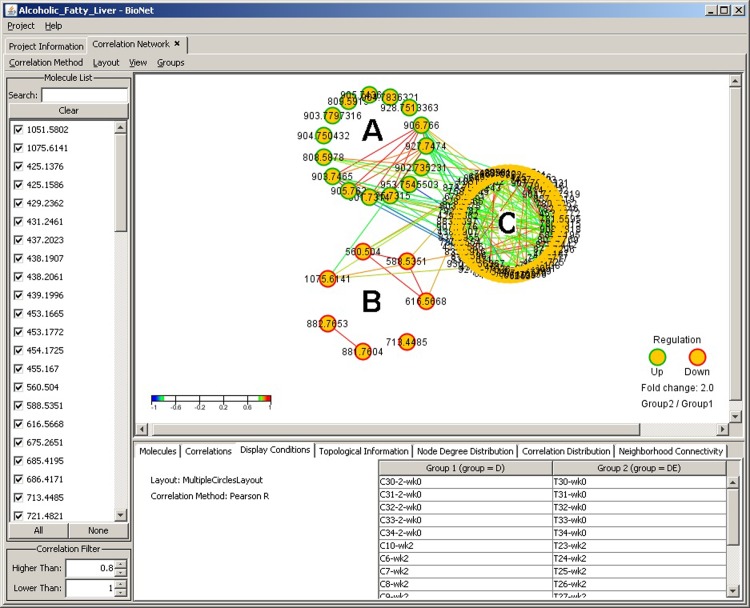
Fig 3. Correlation analysis window with multiple circle layout.
Three-circle network graph display illustrating the up-regulated molecules in green borer nodes(A), down-regulated in red border (B), and other (not differentially expressed) molecules with no border (C). The fold change threshold is set at 2, meaning that molecules regulation that don’t meet this threshold are grouped in the third neutral circle (C). The fold change value can be adjusted accordingly.

