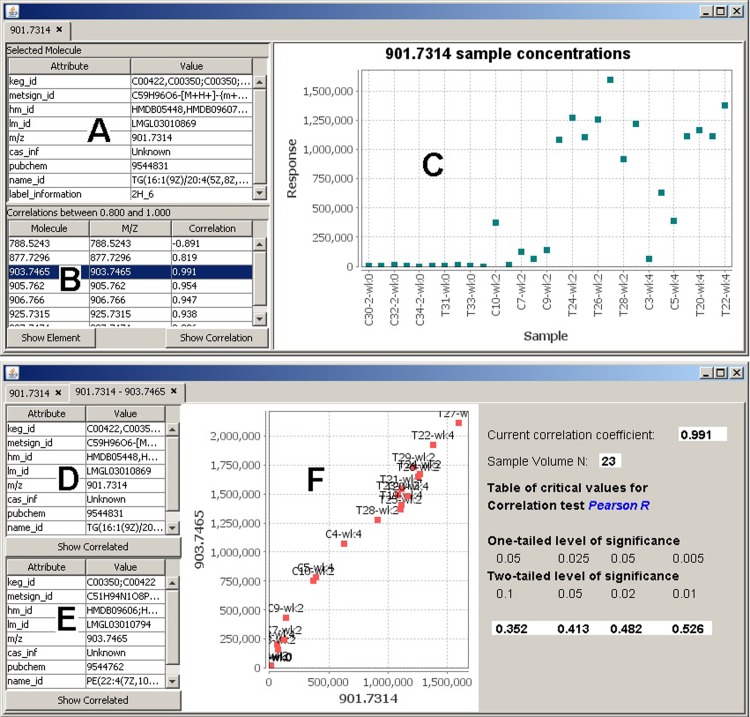
Fig 4. Correlation analysis.
(A) Meta information for molecule 901.7314. (B) List of correlated molecules. Further molecule details can be invoked by highlighting a molecule in this list and choosing wither the “Show Element” or “Show Correlation” buttons. (C) Molecular concentration levels across all samples. (D) Concentration details for molecule 901.7314. (E) Concentration details for correlated molecule 903.7465. (F) Correlation graph showing the expression data of the two molecules. Each point represents the expression levels of both molecules (x-axis and y-axis) in the same sample.

