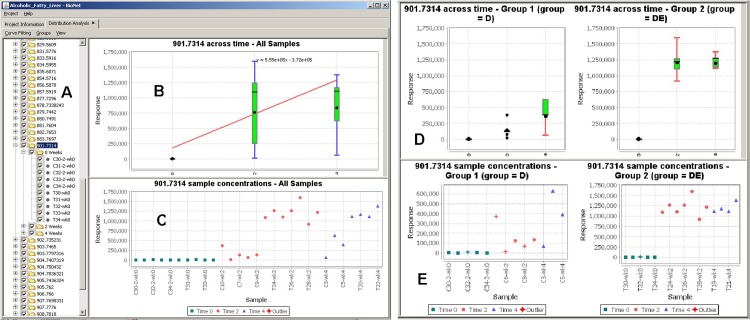
Fig 5. Comparative and distribution analysis.
(A) A tree describing the molecules and their corresponding samples and time points. (B) Box plot displaying the concentration of a selected molecule across time points while applying the Robust Linear fitting. (C) Concentration distribution plot of the molecule across all samples. (D) and (E) display the same plots but for two sample groups (control and test) side-by-side for ease of comparison.

