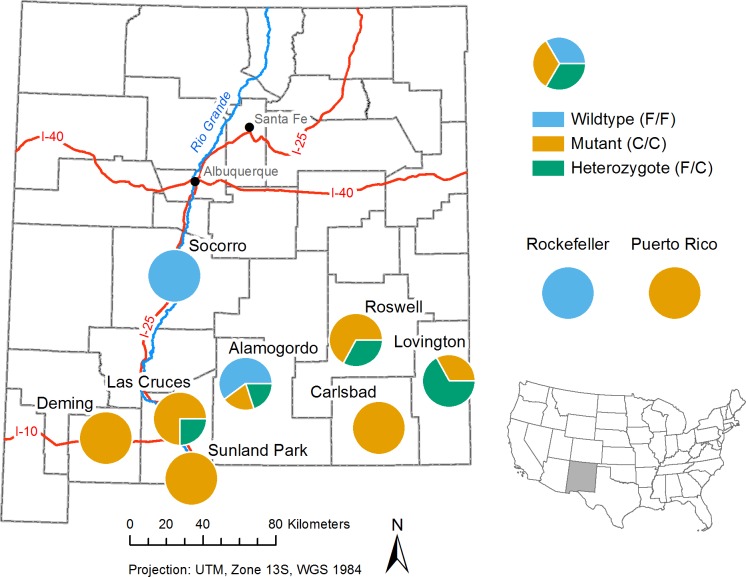
Fig 3. Genotype frequency map.
The pie charts represent the percentage of the three specific kdr F1534C genotypes in mosquitoes collected at different locations. Wildtype, susceptible mosquitoes are shown in blue. Mutant, resistant mosquitoes are shown in yellow. Heterozygotes are shown in green. The genotype frequencies of the laboratory strains, Rockefeller and Puerto Rico, are shown to the upper right of the map. The location of New Mexico within the United States is shown in the lower right of the figure.

