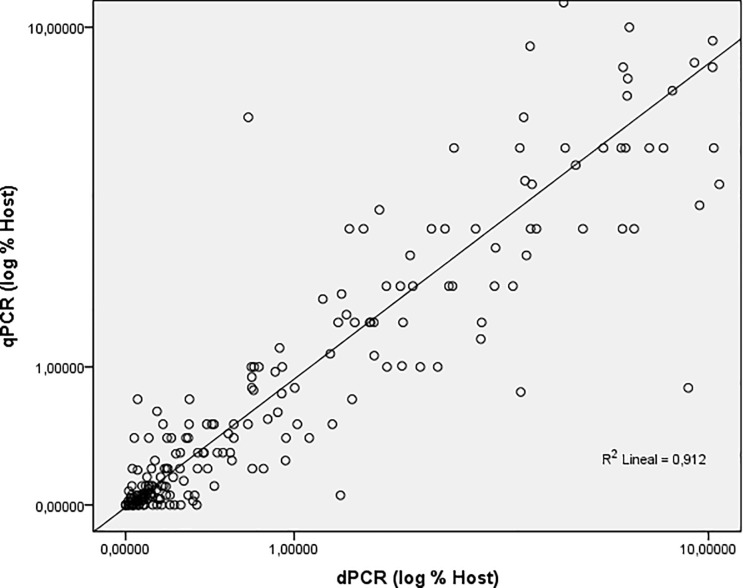
Fig 1. Correlation of hematopoietic chimerism data as obtained on clinical samples by dPCR versus qPCR.
Chimerism was assessed for post-allo-SCT samples and obtained data were analysed for linear regression of logarithmic percent host chimerism. A very high degree of linear correlation (R2 > 0.91) was observed.

