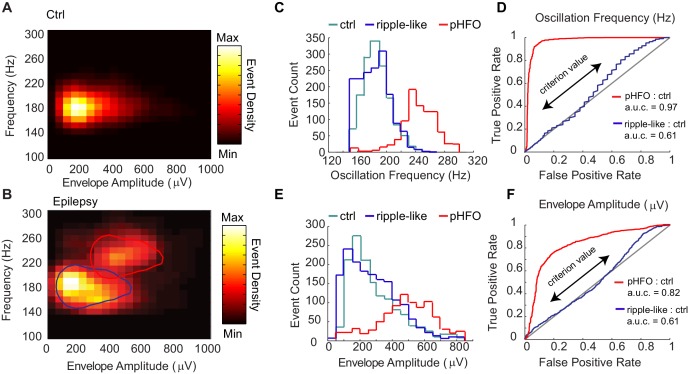
Figure 2. Classification of two types of high-frequency oscillations in animals with epilepsy.
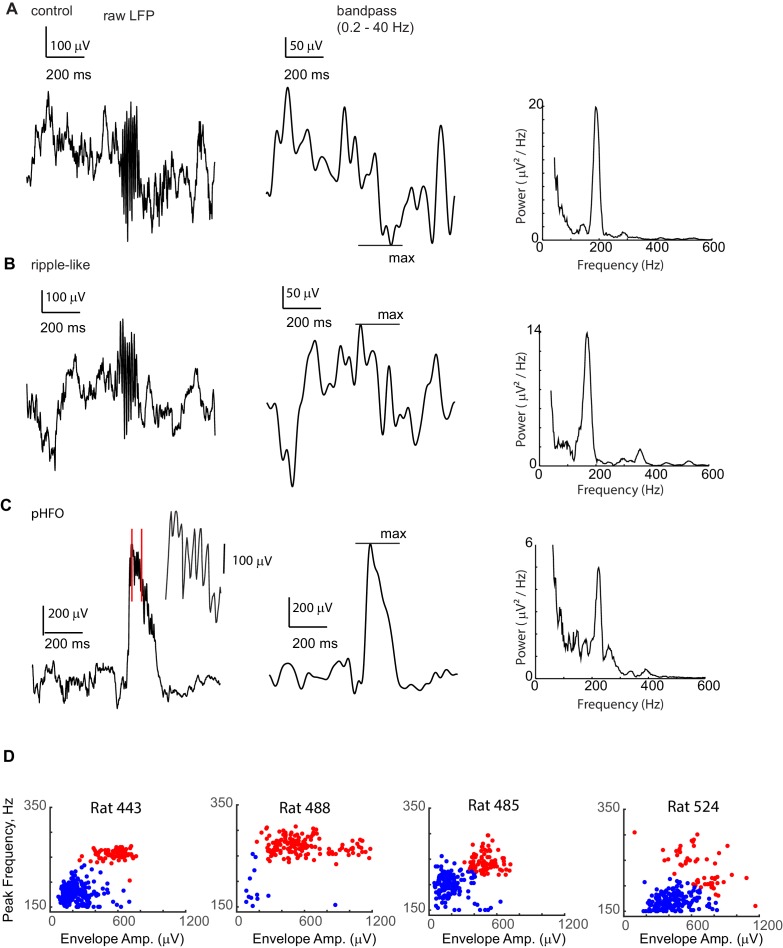
A Density plot of high-frequency oscillations (HFOs) recorded from all sessions in control rats (n = 4 rats, n = 4 sessions). All events were characterized by a single cluster of similar frequency and envelope amplitude. (B) Density plot of HFOs from all sessions recorded from epileptic rats (n = 4 rats, n = 12 sessions). In animals with epilepsy, two clusters are present, one characterized by envelope amplitudes and frequencies that resemble control ripples (circled in blue), and the other characterized by higher frequencies and larger envelope amplitudes (circled in red), and see Figure – Supplement1 A-C. (C) Distribution of the oscillation frequencies for control ripples (cyan, n = 1414), and in animals with epilepsy (blue and red). The two distributions for animals with epilepsy were separated by clustering the data presented in (B), and see Figure – Supplement1D for display of individual animals. Note that the blue population overlaps with control ripples and is thus referred to as ‘ripple-like’ (n = 1616). The red population is separate from control ripples and is thus referred to as ‘pathological HFOs (pHFO)’ (n = 923). (D) The separation (or not) of each cluster in epileptic animals from control ripples is confirmed analytically using a binary classifier and plotted in a Receiver Operator Curve. True positive and false positive rates are plotted with the range of oscillation frequencies used as criteria values (see Materials and methods for more detail). (E, F) The same as (C, D), but for envelope amplitude rather than oscillation frequency.


