. 2019 Feb 22;8:e42148. doi: 10.7554/eLife.42148

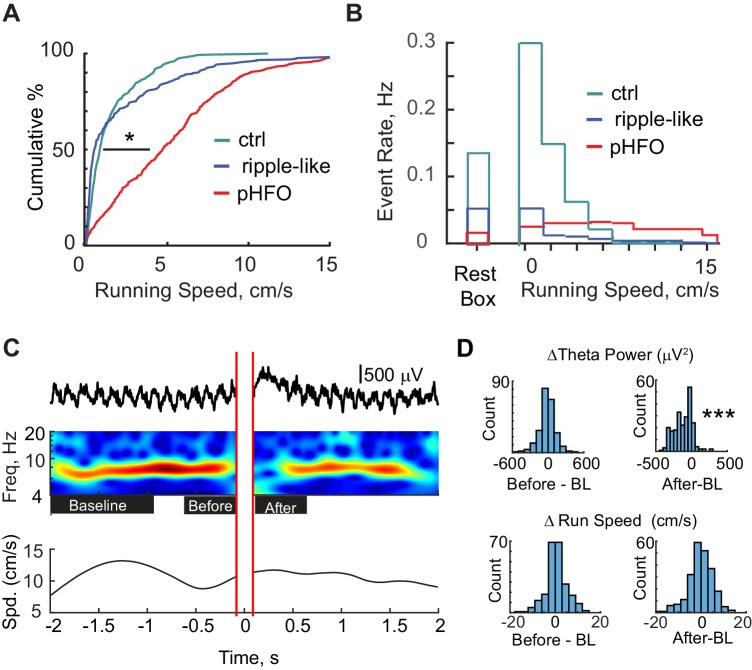
Figure 3. pHFOs occurred during movement-associated theta rhythm.

(A) Cumulative distributions of the running speed at times when a high-frequency oscillation occurred. All data were recorded from behavioral sessions when animals were foraging for food reward and when position and running speed were tracked (n = 691 control ripple, n = 293 ripple-like, n = 490 pHFO). *, p ≤ 0.05, Kruskal-Wallis ANOVA. Control ripple (cyan) and ripple-like (blue) events occur primarily when animals were not moving while pHFOs (red) occurred at all running speeds. (B) Event rates for control ripple (cyan), ripple-like (blue), and pHFOs (red) plotted as a function of time spent in the rest box or time spent at each running speed recorded during foraging experiments. Behavior during recordings in the rest box comprised a mixture of mobile and rest behavior. (C) Top, LFP recorded in stratum radiatum around the time of a pHFO/interictal spike event. The time frequency plot over the four seconds around the event is characterized by strong theta rhythm leading up to the event and a reduction in theta power after the event. Red parallel lines denote the LFP window that was clipped to remove the large interictal spike before wavelet analysis was performed. Bottom, the running speed of the animal plotted over the corresponding four seconds. See Figure 3—figure supplement 1 for theta phase analysis. (D) LFP and running speed around pHFOs that occurred when animals were running at speeds ≥ 5 cm/s were examined for modulation (n = 231). The distributions of the change in theta power (top) or running speed (bottom) compared to baseline (BL) are plotted for the periods before and after interictal events. Time windows are defined as shown by the black boxes in (C). ***, p ≤ 0.001, Wilcoxon Sign Rank test.

Figure 3.

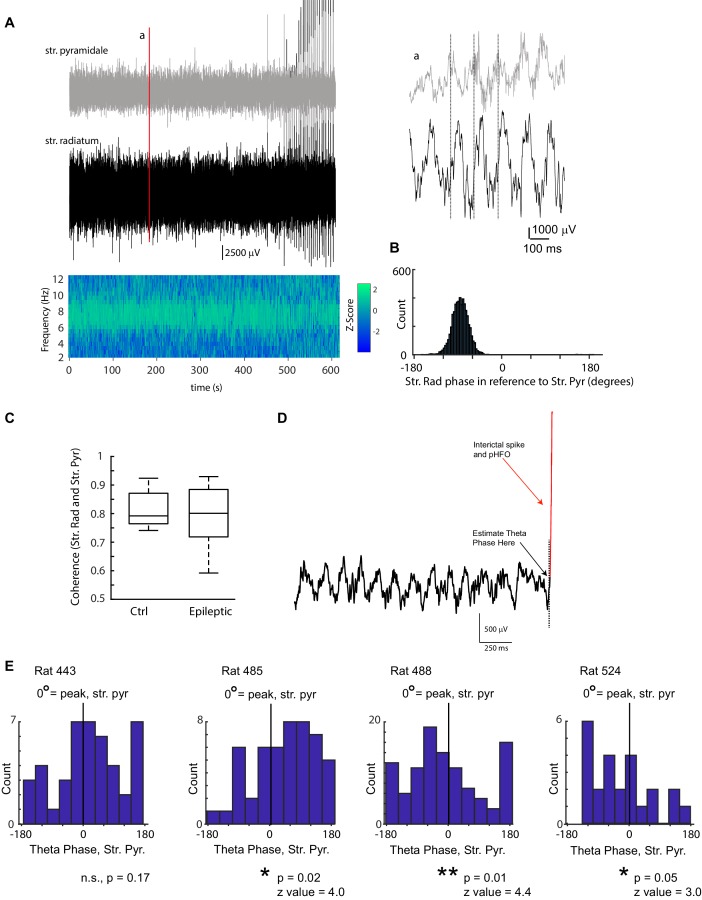
Figure 3—figure supplement 1. pHFOs occur at distinct theta phases unique for each animal.

Figure 3—figure supplement 1.

A LFP traces simultaneously recorded from stratum pyramidale (grey) and stratum radiatum (black) from an epileptic rat during a 10-min foraging session. The coherence between the two recorded sites is plotted below. The strongest coherence was observed in the theta band (7 Hz in this case). Note that toward the end of the recording, interictal spikes (which were associated with pHFO) were observed. Several hundred milliseconds of the two traces are enlarged in (a) to illustrate the prominence of theta rhythm in the raw data and the phase shift between the two layers. In this example, theta in stratum pyramidale is leading theta in radiatum by ~90 °, which is quantified in (B). (B) The phase lag at the frequency with the highest coherence (7–9 Hz) between stratum pyramidale and radiatum was calculated for each foraging session. The example shown, corresponds to the data shown in (A). (C) No difference was observed in the coherence of the two recording sites (stratum radiatum and stratum pyramidale) between control and epileptic rats (ctrl, n = 10; epilepsy, n = 12; Wilcoxon Rank Sum Test, p = 0.67, z = 0.4). (D) To determine the theta phase at which interictal spikes and pHFOs occurred, LFP traces recorded at stratum radiatum were clipped at the moment the interictal spike occurred and the phase was estimated (see Materials and methods, Analysis of theta oscillations). In this example, the trace was clipped at the dotted line. (E) For each animal the phase distribution of interictal spikes/pHFO are shown in reference to theta rhythm in stratum pyramidale (0 ° corresponds to the peak of a theta cycle). The distribution of theta phase associated with interictal spike/pHFO occurrence shows a clear phase modulation in 3 of four animals (Raleigh Test), however the phase modulation was inconsistent between animals (for the three that reached significance; mean phase ± SEM; 62.1 ± 9.7,–63.5 ± 7.0,–56.8 ± 13.3).