. 2019 Feb 22;8:e42148. doi: 10.7554/eLife.42148

Figure 4. CA1 principal neurons increase firing rates during control ripple, ripple-like events, and pHFOs.

(A) Coronal section through the area of the hippocampus with tetrode tracks in the CA1 area. The area in the black box is magnified in the inset on the upper left. The tetrode position for the spike recordings in (B) is indicated by an arrow. Scale bar, 300 µm. (B) Scatterplots of spike amplitudes on two of the four recording channels (ch2, ch3) from the tetrode identified in (A). Each colored cluster corresponds to spikes from one cell, and insets show average waveforms of two well-isolated cells. Noise spikes are shown in grey. The similarity of the scatterplots and waveforms across the rest and foraging epochs indicates that the same cells were reliably recorded throughout the session. For more details about single unit sorting, see Figure – Supplement 1.( C) Each row in the heat map is the average rate vector for an individual control CA1 principal neuron aligned to ripple events (time 0). Average rates are normalized to their peak and range from 0 (black) to 1 (white). Neurons are sorted by ripple-modulation significance such that strongly modulated neurons are at the top. Neurons that show significant modulation (p <0.05, *) are marked by a black dash to the left of the row. Almost all control neurons are ripple-modulated (91%), and fire maximally during the ripple period (time 0). (D) The same as (C), but for neurons recorded in animals with epilepsy during ripple-like events (left, 46% of neurons were modulated). (E) The same as (C), but for neurons recorded during pHFO events (right, 21% of neurons were modulated). Please note that neurons in (D) and (E) are ordered differently, therefore cell identity across rows are not comparable. For rates and p-values see Figure – source data (1–3, corresponding to C-E).

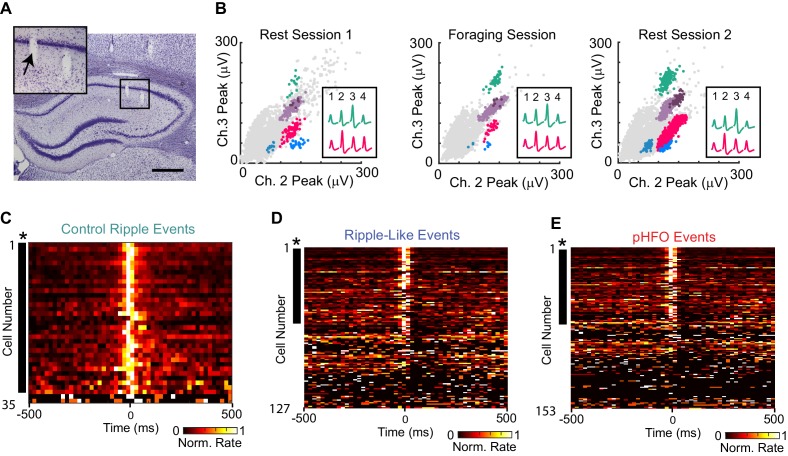
Figure 4—source data 1. Neuron activity during control ripple.
Source data correspond to data shown in panel C. For each neuron (neuron # is a unique identifier given to each single unit in the study) several data are shown: (from left to right) the # of SWR ripples (for control), mean rate during baseline (BL), mean rate during detected high-frequency ripple events, and the p-value obtained using a Wilcoxon signed rank test. Neurons are ordered according to p-value, with the smallest p-values at the top. The solid line separates neurons that significantly changed rate during a high-frequency event from those that did not. Neuronal activity during ripple-like oscillations are reported in Figure 4—source data 2 and during pHFO in Figure 4—source data 3.
DOI: 10.7554/eLife.42148.010
Figure 4—source data 2. Neuron activity during ripple-like oscillations.
Source data correspond to data shown in panel D. For each neuron (neuron # is a unique identifier given to each single unit in the study) several data are shown: (from left to right) the # of ripple-like oscillations (R–L), mean rate during baseline (BL), mean rate during detected high- frequency R-L events, and the p-value obtained using a Wilcoxon signed rank test. Neurons are ordered according to p-value, with the smallest p-values at the top. The solid line separates neurons that significantly changed rate during a high- frequency event from those that did not. Note that all neurons listed in Figure 4—source data 2 are also in Figure 4—source data 3 (but not vice versa), and can be compared by looking at neuron number.
DOI: 10.7554/eLife.42148.011
Figure 4—source data 3. Neuron activity during pHFO.
Source data correspond to data shown in panel E. For each neuron (neuron # is a unique identifier given to each single unit in the study) several data are shown: (from left to right) the # of pHFOs recorded, mean rate during baseline (BL), mean rate during detected high- frequency events, and the p-value obtained using a Wilcoxon signed rank test. For each table, neurons are ordered according to p-value, with the smallest p-values at the top. The solid line separates neurons that significantly changed rate during a high- frequency event from those that did not. Note that all neurons listed in Figure 4—source data 2 are also in Figure 4—source data 3 (but not vice versa), and can be compared by looking at neuron number.
DOI: 10.7554/eLife.42148.012

Figure 4.

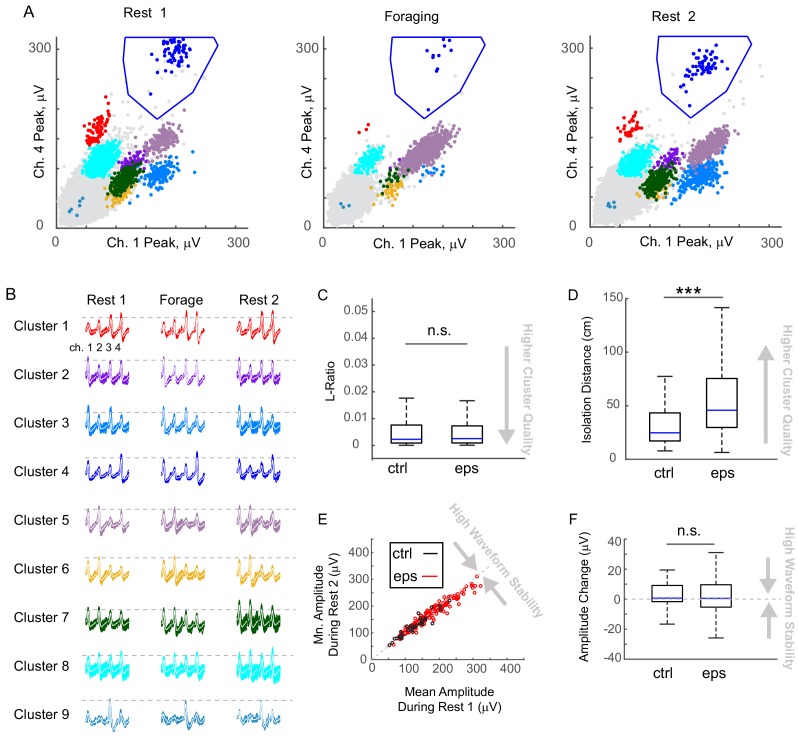
Figure 4—figure supplement 1. Spike waveforms are equally stable in control and epileptic animals and cluster quality is high in both groups.

Figure 4—figure supplement 1.

(A) Scatterplots of spike amplitudes on two of the four recording channels (ch1, ch4) from a tetrode different from the one shown in the main Figure 4, but also implanted in an animal with epilepsy. Each colored cluster corresponds to spikes from one cell. In this projection (peaks from ch1, peaks from ch4), the cluster denoted by dark blue was clearly distinct from the noise and far from other clusters (cells), therefore boundaries were drawn around the cluster to define it. The gray dots within these boundaries were excluded by boundaries set in a different projection. All boundary definitions were assigned manually, i.e. we did not employ automated spike sorting. Note, the relationship of spike clusters to other cells and the noise did not change for a cluster over the recording session. (B) For each cluster shown in (A), the waveforms recorded on each tetrode channel (1 – 4) are shown for each behavioral period, with average waveforms superimposed in white. Dotted lines are drawn to mark the height of the average waveform at its largest in Rest 1, and extended so that a by-eye comparison can be made across the behavioral periods. Although different firing rates can be observed during different behavioral periods, the relationship of the spike amplitude across channels remains constant. This consistency is an indicator of a stable tetrode position in relation to the cell layer. (C) L-Ratio was the same for clusters recorded in control (n = 203; median, IQR, 0.0023, 0.0009–0.0076) and in epileptic animals (n = 795; median, IQR, 0.0025, 0.0009 -. 0073) (p = 0.54, Wilcoxon Rank Sum Test, z-value = −0.6). (D) Isolation distance was large in control and epileptic animals (98.7% of clusters had isolation distance > 10 cm). In epileptic animals, the isolation distance (n = 795; median, IQR, 48.6, 32.6–78.3) was larger than in controls (n = 203; median, IQR, 24.7, 17.1–43.3) (p = 5.1 * 10−29, Wilcoxon Rank Sum Test, z-value = −11.2). (E) for each cell, the channel that recorded the largest waveform in the first session (e.g., channel 4 for cluster one shown in (B)) was selected, and the average waveform is plotted for Rest one versus Rest 2. Note that all cells lie close to the identity line, confirming that waveforms were stable across the entire recording. (F) Changes in waveform amplitude from the first to the second rest session were the same for cells recorded in control (n = 35; median, IQR, 0.7–1.6 – 9.1) and epileptic animals (n = 177; median, IQR, 1.8,–4.1 – 10.8)(not significant, Wilcoxon Rank Sum Test, p = 0.57, z-value = −0.57). The results in (C) – (F) indicate that cluster quality does not differ significantly between control and epileptic animals, and when there is a significant difference it is toward higher cluster quality in epileptic animals.