. 2019 Feb 8;8:e42386. doi: 10.7554/eLife.42386

Figure 1. Osteoprogenitor-derived Bmp2 couples length to width in the appendicular skeleton.

(a,b) Representative 3D reconstructions of the murine femur using microcomputed tomography (microCT). (c) Femoral length or (d) femoral width at mid-diaphysis, presented as mean ± s.d. with n = 8–20 bones per age per genotype. *p<0.05, **p<0.005, or ***p<0.0005 vs. age-matched Bmp2 Prx1-cKO cohort. (e,g) Representative toluidine blue histology at the mid-diaphysis of the forelimb. (f,h) MicroCT analysis of total cross-sectional bone tissue area presented as mean ±s.d. with n = 4. *p>0.05. (i,j) Cross-sectional composition of cortical bone in the radius of newborn (n = 6–9 per genotype) or 2 week-old mice (n = 3–9 per genotype) (see Materials and methods). Abbreviations: PC, perichondrium; PO, periosteum. (k,l,m) Representative toluidine blue histology at the mid-diaphysis of indicated skeletal elements. (n) Length or (o) width of embryonic day 15 metatarsals, measured following 1 or 5 days of ex vivo culture. Mean ±s.d. with n = 6–12 where **p<0.005, ***p<0.005, or ****p<0.00005. (p,q,r) Femur width mean ±s.d. with n = 6–12 where *p<0.05. (s) Minimum moment of inertia in P14 femur, calculated by microCT (n = 4) shown as mean ±s.d. where ***p<0.0005. (t) Toludine blue histology revealing cortical microcracks in the humerus of Bmp2 Prx1-cKO mice at 4 weeks of age. (u) X-ray images showing representative bowing of the radius and ulna of Bmp2 Prx1-cKO mice in the absence of frank fractures. Statistical analyses were performed using two-tailed Student’s t-test.

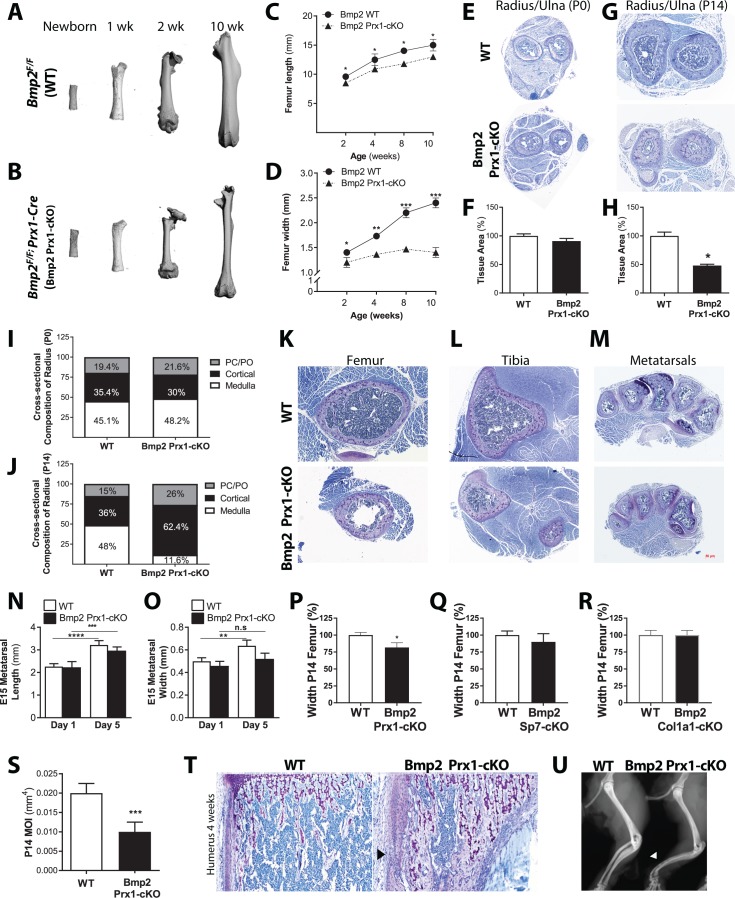
Figure 1.

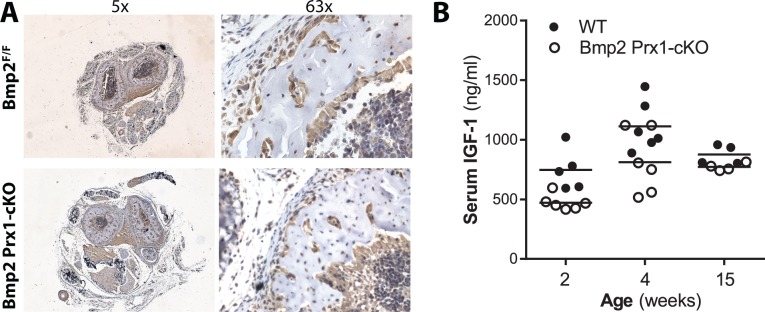
Figure 1—figure supplement 1. BMP2 acts downstream of IGF-1 pathway in the periosteum.

Figure 1—figure supplement 1.

(a) Persistence of IGF1 +cells in Bmp2 Prx1-cKO periosteum. Transverse sections of the radius and ulna were imaged in brightfield following immunostaining to visualize cells expressing IGF-1. (b) Elisa analysis demonstrates that circulating levels of IGF-1 are not statistically reduced in Bmp2 Prx1-cKO mice.
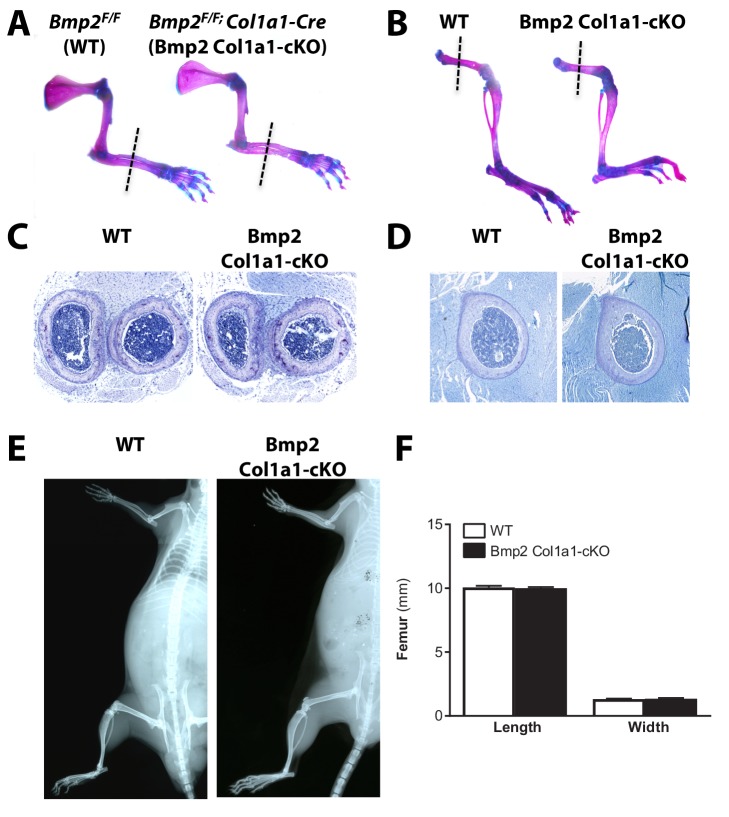
Figure 1—figure supplement 2. Skeletal phenotype analysis of Bmp2Flox/Flox; Col1a1-Cre mice shows that loss of Bmp2 in mature osteoblasts does not cause a periosteal growth defect.

Figure 1—figure supplement 2.

(a,b) Alizarin red and alcian blue whole mount staining of (a) forelimbs and (b) hindlimbs from at postnatal day 14 mice. (c,d) Representative toluidine blue histology at the mid-diaphysis of the (c) forelimb or (c) femur at postnatal day 14. (e) X-ray imaging shows that Bmp2 Col1a1-cKO reach peak adult body size with no evidence of spontaneous fractures. (f) Length and width remain coupled at postnatal day 14 following ablation of Bmp2 in mature osteoblasts.
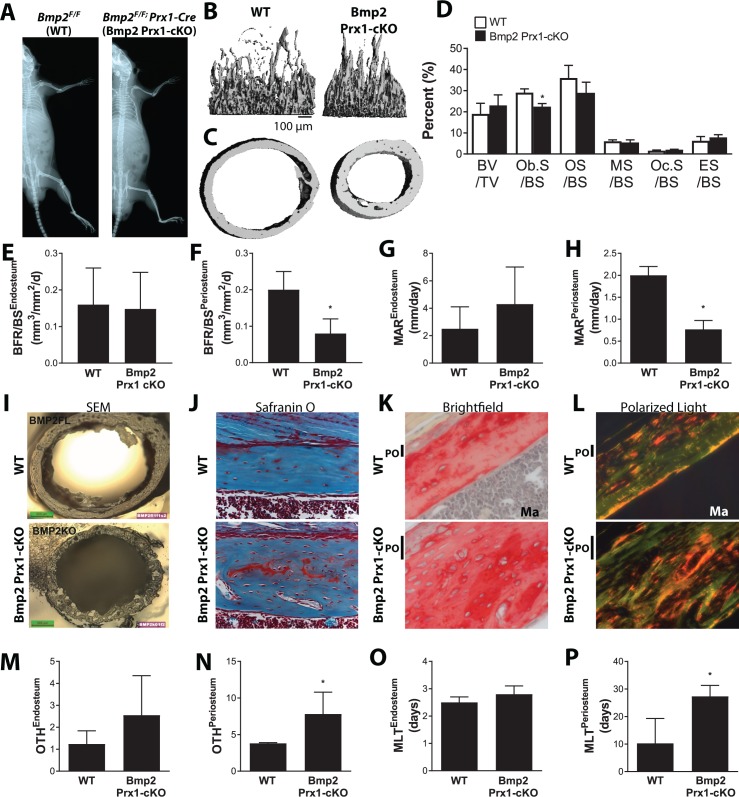
Figure 1—figure supplement 3. Skeletal phenotype analysis of Bmp2Flox/Flox; Prx1-Cre mice reveals architectural abnormalities compounded by material defects.

Figure 1—figure supplement 3.

Bone mass analyzed in the femur of juvenile (2 week-old) mice by microcomputed tomography (microCT). (a) X-ray imaging shows that Bmp2 Prx1-cKO reach peak adult body size despite slender bones. (b) Trabecular bone at the distal metaphysis and (c) cortical bone at the mid-diaphysis of the femur visualized by 3D reconstructions. Images represent the group mean and are shown to scale. (d–h) Dynamic histomorphometry assessing bone formation rate as a function of bone surface (BFR/BS) at (e) endosteal versus (f) periosteal surfaces, or mineral apposition rate (MAR) at (g) endosteal versus (h) periosteal surfaces. n = 4, presented as mean ±s.d. where *p<0.05 vs. age-matched Bmp2F/F littermates. (i) Scanning electron microscopy of cross-sections at the femoral mid-diaphysis. (j) Residual cartilage islands and increased osteocyte density in the femur of Bmp2 Prx1-cKO mice visualized by safranin O and nuclear red staining. (k,l) Picrosirius red and hematoxylin stain, followed by polarized light microscopy reveal accumulation of disorganized collagen extracellular matrix in the femur of Bmp2 cKO mice. (m–p) Dynamic histomorphometry assessing osteoid thickness (OTH) at (m) endosteal versus (n) periosteal surfaces, or mineralization lag time (MLT) at (o) endosteal versus (p) periosteal surfaces. n = 4, presented as mean ±s.d. where *p<0.05 vs. age-matched Bmp2F/F littermates.