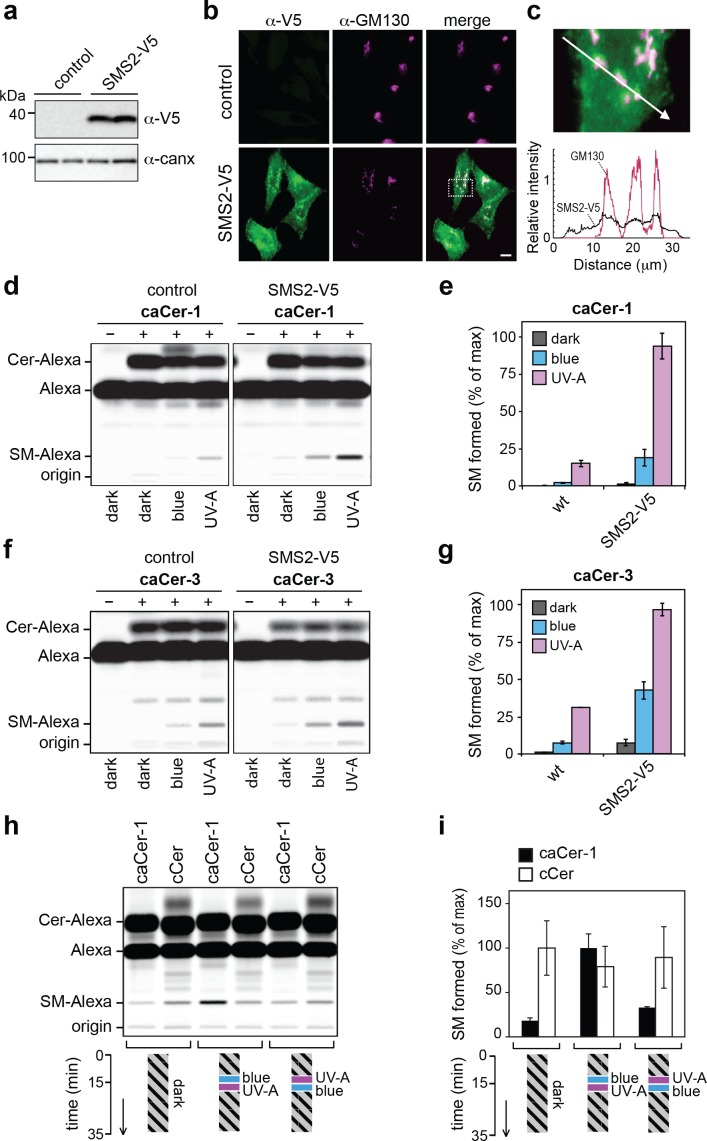
Figure 5. caCers enable optical control of SMS2-mediated SM biosynthesis in living cells.
(a) HeLa cells stably transfected with V5-tagged SMS2 were analyzed by immunoblotting using anti-V5 and anti-calnexin antibodies. Untransfected HeLa cells served as control. (b) Control and SMS2-V5-expressing HeLa cells were fixed, co-stained with antibodies against the V5 epitope and Golgi marker GM130, and then visualized by fluorescence microscopy. Scale bar, 10 μm. (c) Intensity plots along the path marked by the white arrow, showing overlap between anti-V5 (green) and anti-GM130 (magenta) channels. (d) Blue, UV-A or dark-adapted caCer-1 was incubated with control or SMS2-V5-expressing HeLa cells for 1 hr at 37°C. Metabolic conversion of caCer-1 to SM was determined by TLC analysis of total lipid extracts click-reacted with Alexa-647. (e) Quantitative analysis of SM formed from caCer-1 by cells treated as in (c). (f) Blue, UV-A or dark-adapted caCer-3 was incubated with control or SMS2-V5-expressing HeLa cells for 1 hr at 37°C and its metabolic conversion to SM was determined as in (c). (g) Quantitative analysis of SM formed from caCer-3 by cells treated as in (e). (h) caCer-1 or cCer were incubated with SMS2-V5-expressing HeLa cells at 37°C in the dark. After 15 min, cells were flash-illuminated by blue light followed by UV-A or vice versa and then incubated for another 20 min. Cells kept in the dark for the entire incubation period served as control. Metabolic conversion of caCer-1 or cCer to SM was determined by TLC analysis of total lipid extracts click-reacted with Alexa-647. (i) Quantitative analysis of SM formed from caCer-1 or cCer by cells treated as in (g). Data shown are mean values ± s.d. from three biological replicates (n = 3).

