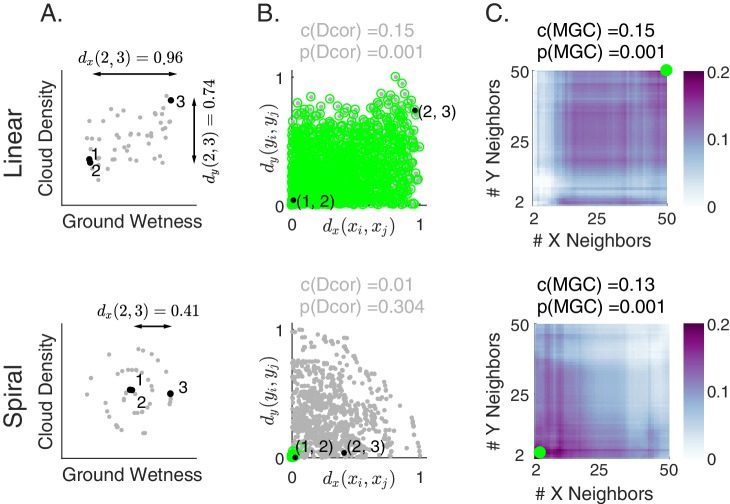
Figure 1. Illustration of Multiscale Graph Correlation (Mgc) on simulated cloud density () and grass wetness ().
We present two different relationships: linear (top) and nonlinear spiral (bottom; see Materials and methods for simulation details). (A) Scatterplots of the raw data using pairs of samples for each scenario. Samples , , and (black) are highlighted; arrows show distances between these pairs of points while their distances are almost 0. (B) Scatterplots of all pairs of distances comparing and distances. Distances are linearly correlated in the linear relationship, whereas they are not in the spiral relationship. Dcorr uses all distances (gray dots) to compute its test statistic and p-value, whereas Mgc chooses the local scale and then uses only the local distances (green dots). (C) Heatmaps characterizing the strength of the generalized correlation at all possible scales (ranging from to for both and ). For the linear relationship, the global scale is optimal, which is the scale that Mgc selects and results in a p-value identical to Dcorr. For the nonlinear relationship, the optimal scale is local in both and , so Mgc achieves a far larger test statistic, and a correspondingly smaller and significant p-value. Thus, Mgc uniquely detects dependence and characterizes the geometry in both relationships.

