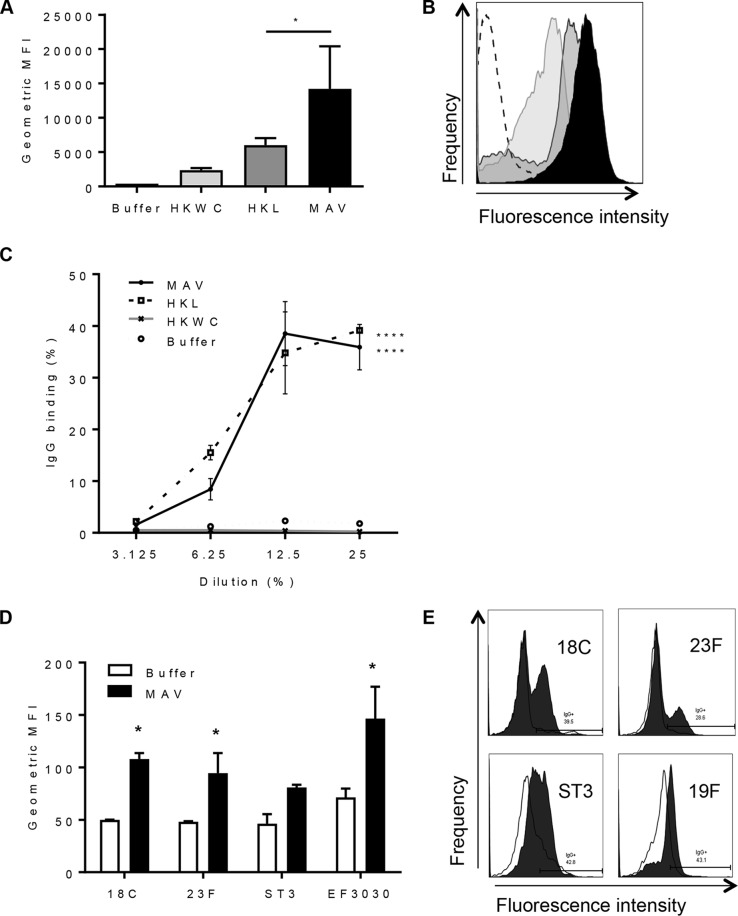
FIG 3.
Binding of immune mouse sera to the surface of S. pneumoniae strains. (A) The results of IgG surface binding assays of S. pneumoniae TIGR4 incubated in sera from vaccinated mice are shown as the geometric mean fluorescence index (MFI). Error bars represent the SD from technical replicates. Significance is calculated with the Holm-Sidak test. *, P < 0.05. (B) Representative flow cytometry histograms showing IgG-positive S. pneumoniae TIGR4 populations. White histogram, buffer negative-control serum; black histogram, serum from MAV-vaccinated mice; dark gray histogram, serum from HKL-vaccinated mice; light gray histogram, serum from HKWC-vaccinated mice. (C) IgG binding to TIGR4 in immune serum diluted to 25, 12.5, 6.25, and 3.125%. Data points are means from technical replicates; error bars represent standard deviations. Significance values between each dilution curve were calculated by using a two-way ANOVA and comparison to the buffer negative control. ****, P < 0.001. (D) Mean fluorescent IgG surface binding to S. pneumoniae serotype 18C, 23F, ST3, and 19F strains incubated in sera from MAV- or buffer-vaccinated mice. Error bars represent standard deviations from technical replicates. Significance was calculated with the Holm-Sidak test. *, P < 0.05. (E) Representative histograms showing a shift in populations positive for IgG against different strains of S. pneumoniae. White histogram, IgG binding in buffer-vaccinated mouse serum; shaded histogram, binding in MAV-vaccinated mouse serum.

