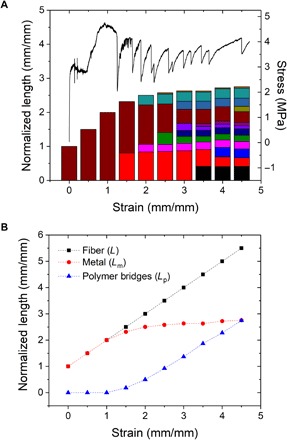
Fig. 2. Characterization of metamaterial fiber behavior.

(A) Stacked graph of normalized length of gallium segments (left ordinate) at 50% strain intervals for a fiber up to 450% strain. Different colors represent different segments of metallic core within a single fiber. A stress-strain curve for the fiber is overlaid (right ordinate). (B) Graph of the normalized total length of metal segments (red circles) and polymer bridges (blue triangles) compared to the normalized total fiber length (black squares). The dashed lines guide the eye.
