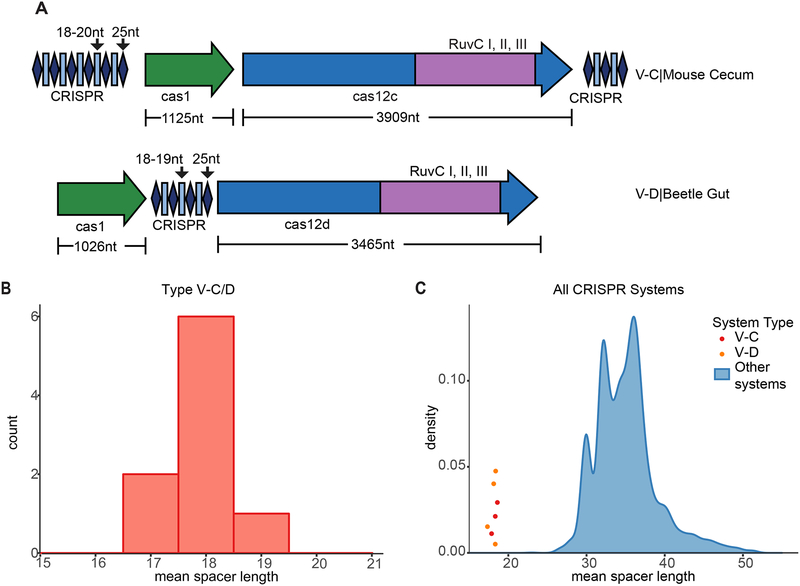
Figure 1. Type V-C and V-D CRISPR Systems Have Short Repeats and Spacers and Lack cas2 Genes.
(A) CRISPR-Cas loci of the effector proteins of the type V-C system from mouse cecum and V-D system from beetle gut with lengths of genes and repeats and spacers. See Table S1 for protein sequences.
(B) Distribution of mean spacer lengths of type V-C/D systems.
(C) Comparison of mean spacer length for V-C/D vs. other CRISPR-Cas systems. The blue density plot depicts the distribution of mean spacer length in CRISPR-Cas systems, excluding V-C/D systems. The mean spacer lengths of published V-C and V-D systems are noted in red and orange dots, respectively, with arbitrary y-values to set them apart.

