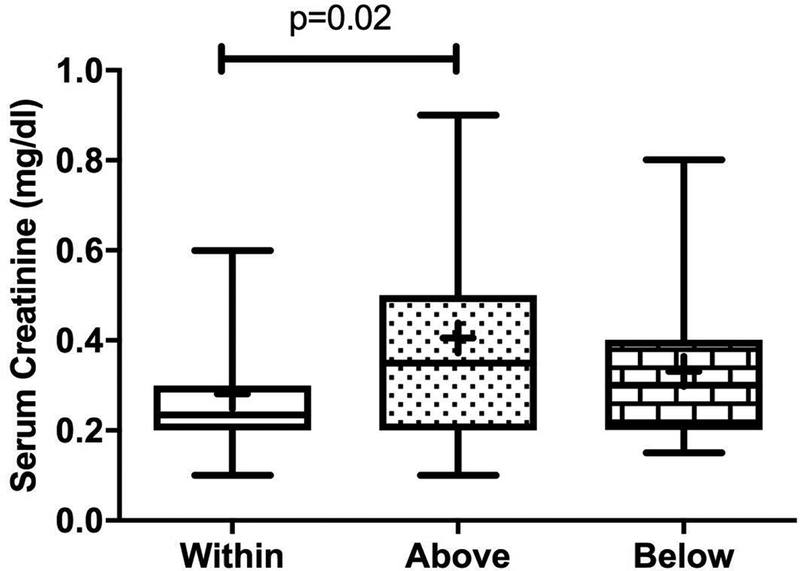
Figure 2:

Box-and-whiskers plot of the type of target achieved (in, above, and below target) for the 120–160 ng/ml*hr AUC range for the empiric dose based on serum creatinine. The line in the middle of each box represents the median, the “+” is the mean, the boxes represent the 25th and 75th percentiles, and the upper and lower bars represent the minimum and maximum serum creatinine values, respectively. P-value = 0.02 (ANOVA).
