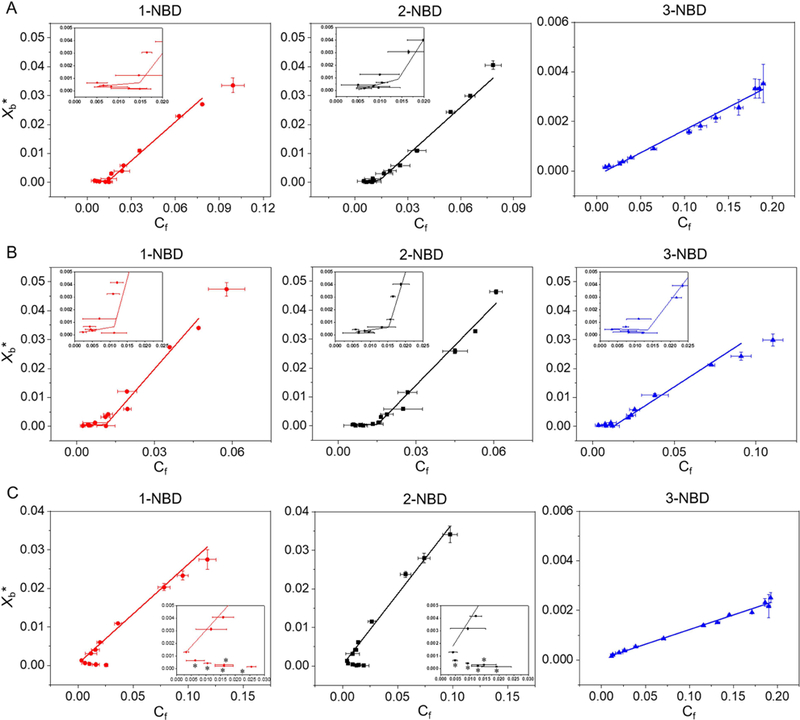
Figure 3.

Binding isotherms of NBD-labeled β-peptides (0.2 µM) to (A) PC:PE (60:40), (B) PC:PG (60:40) and (C) PC:PE:ergosterol (50:30:20) SUVs ([lipid] = 5 to 2000 µM) with the indicated compositions after 2 min incubation. Xb* represents the molar ratio of bound peptide per 60% of total lipid and Cf is the equilibrium concentration of free peptide in solution. The partition coefficient is the slope of the binding isotherm and the critical concentration is the intersection of the low-slope and high-slope isotherms, shown in the insets. The placement of asterisk (*) near a data point indicates conditions at which vesicle aggregation was observed visually (see text). Data points represent the averages of three independent experiments and error bars denote standard deviation (n = 3). Lines in A, B, and C show linear and non-linear (piecewise fit lines by piecewise fitting function (pwl2s) consisting of two linear segments) data fits. The statistical data for each fit are: red line in A (non-linear fit, p = 0.0014, R2 = 0.85, intercept = 14.8 nM), black line in A (non-linear fit, p = 7.82 × 10⁻⁵, R2 = 0.87, intercept = 14.3 nM), blue line in A (linear fit, p = 1.71 × 10⁻¹¹, R2 = 0.98); red line in B (non-linear fit, p = 1.51 x= 10−6, R2 = 0.96, intercept = 11.3 nM), black line in B (non-linear fit, p = 1.13 × 10⁻⁵, R2 = 0.91, intercept = 14.1 nM), blue line in B (non-linear fit, p = 5.89 × 10⁻⁴, R2 = 0.80, intercept = 13.0 nM); red line in C (linear fit, p = 9.33 × 10⁻⁷, R2 = 0.98), black line in C (linear fit, p = 5.83 × 10⁻⁸, R2 = 0.98), blue line in C (linear fit, p = 3.00 × 10⁻¹³, R2 = 0.99). See also Figures S4 and S5, and Tables S3 and S4.
