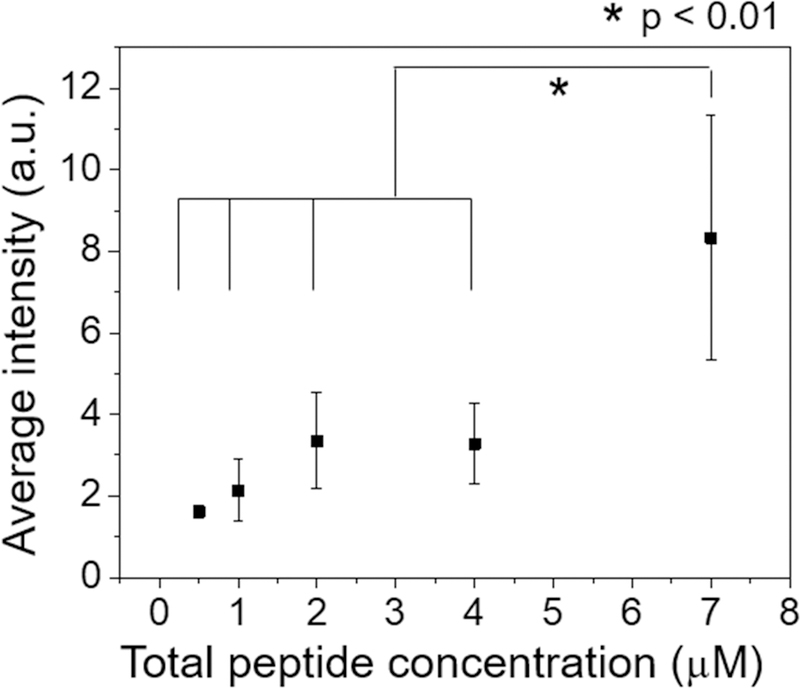
Figure 4.

Cooperative insertion of β-peptide 1-Cy5 in the C. albicans plasma membrane. Cy5 fluorescence intensity associated with each cell was measured by fluorescence microscopy after 3 min incubation with a solution of 0.5 µM β-peptide 1-Cy5 and 0 – 6.5 µM β-peptide 1 in DPBS. The fluorescence intensity was measured for individual cells and then background intensity subtracted (Fig. S6). The images was acquired using same detector gain, amplifier gain, and pinhole settings. Data points are the averages of three independent experiments with approximately 20 cells/experiment, and error bars denote standard deviation (n = 3). Statistical analysis was performed using one-way ANOVA. See also Figure. S6.
