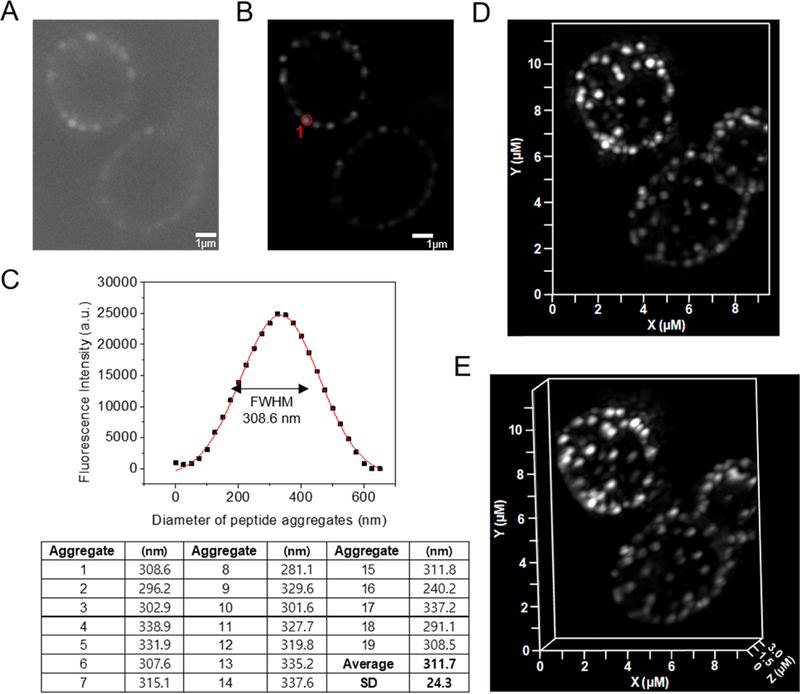
Figure 5.

SR-SIM of β-peptide aggregation on the plasma membrane of C. albicans. 2 µM β-peptide 1-Cy5 was added to C. albicans cells and cells were imaged after 3 min incubation. Panel (A) shows a sample raw z-section image while panel (B) shows the same image processed using Zeiss ZEN software. (C) Fluorescence intensity distribution of the peptide aggregate circled in red in (B). To measure the size of peptide aggregate, the fluorescence intensity vs diameter plot was fit to a Gaussian distribution (red line). The full width at half maximum intensity illustrates the aggregate size distribution. Average peptide aggregate size was calculated from 19 aggregates from 5 different cells. SD denotes standard deviation (n = 19). Panels (d) and (e) show 3D-SR SIM image projections of stacked of Z-sections. Scale bar indicates 1 µm in (A) and (B).
