Figure 6.

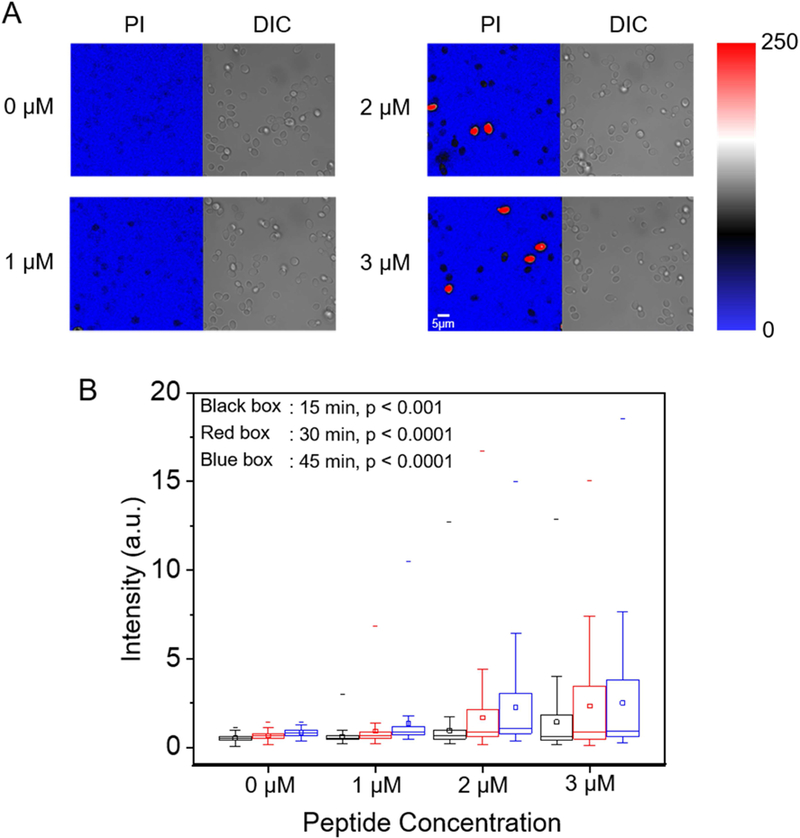
PI uptake into live C. albicans. Cells were incubated with 10 µg/mL PI and the indicated sub-MIC concentration of β-peptide 1 (1, 2, or 3 µM) in DPBS. (A) CLSM and corresponding DIC images of PI uptake into C. albicans after 45 min incubation in β-peptide solutions of the indicated concentrations. Color represents fluorescence imaging pixel values. Red cells are lysed cells that were excluded from quantitative analysis. Scale bar indicates 5 µm. (B) Box chart of the distribution of PI uptake in live C. albicans as a function of β-peptide concentration and incubation time. Black, red, and blue bars represent 15 min, 30 min, and 45 min incubation times, respectively. The box chart shows median intensity values (solid horizontal line in the box), average intensity (open square in box), 50th percentile values (box outline), 10th and 90th percentile values (whiskers), and minimum and maximum intensities (−). Statistical analysis was performed using one-way ANOVA. p-Values compare cells exposed to β-peptides to no-peptide controls. See also Figure S7.
