
Figure 4: Polysome profiling experiments elucidate mode of 4’s inhibition of RAN translation.
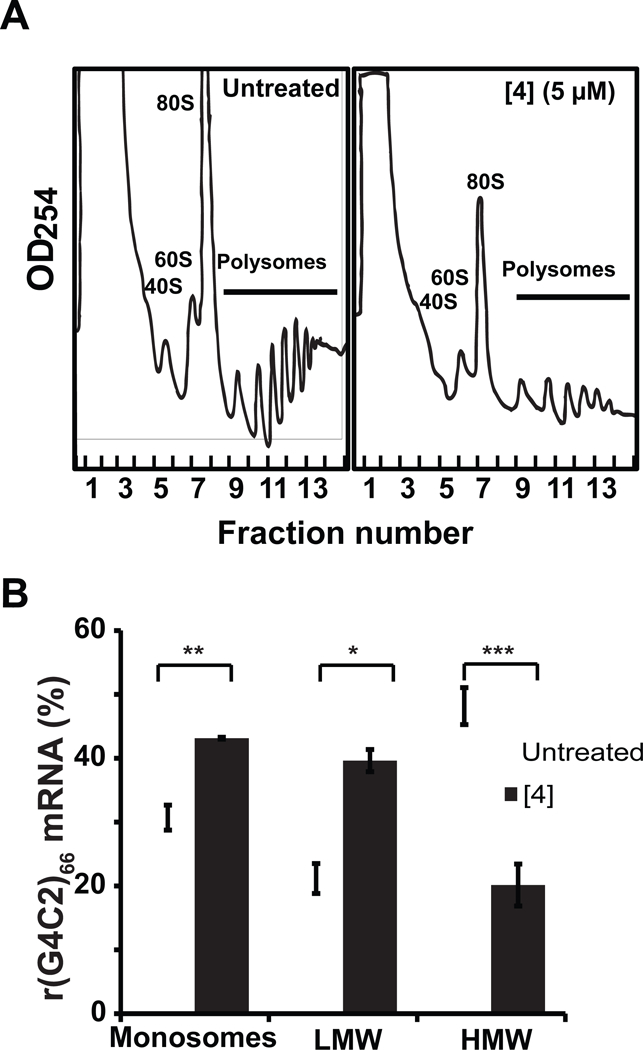
A, Polysome fractionation profiles of cell lysates obtained from HEK293T cells transfected with (G4C2)66-No ATG-GFP plasmid upon treatment with 4 or vehicle (DMSO). Polysome fractionation profiles are representative of two independent experiments. B, Percentage of (G4C2)66-No ATG-GFP mRNA transcript present within monosome and polysome-containing fractions with (white) and without (black) treatment of 4. Fractions labeled as “Monosomes” contain 40S, 60S and 80S ribosomal subunits; “LMW” indicates low molecular weight polysomes; and “HMW” indicates high molecular weight polysomes. *, p < 0.05; **, p < 0.01; *** p <0.001, as determined by a two-tailed Student t test.