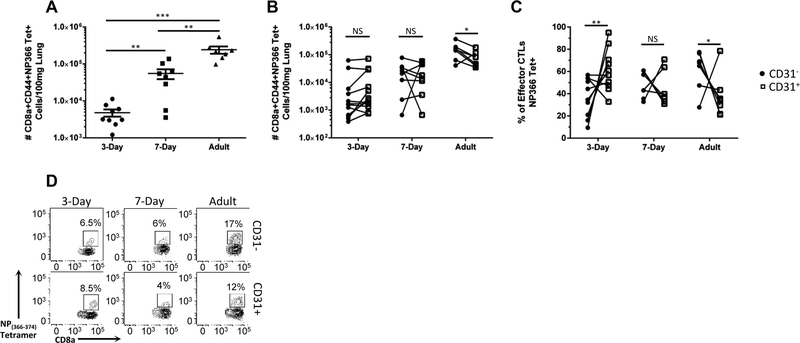
FIGURE 1. Characterization of viral-specificity of murine neonatal and adult CD31+ CTLs.
Lungs were harvested from animals on day 9 post-influenza virus infection. Number of NP(366–374) tetramer positive effector CTLs normalized per 100 mg of lung tissue is depicted (A). Each dot represents a single animal. (n = 8–12 animals per group, four independent experiments). (B) Number of CD31+ and CD31− NP(366–374) tetramer positive effector CTLs. (C) Percentage of NP(366–374) tetramer positive effector (CD44+CD62L−) CD31+ or CD31− cells of the total NP(366–374) viral-specific pool within the lung from absolute numbers in (B). (D) Representative flow plots depicting the tetramer positive population for CD31− (Top row) and CD31+ (Bottom row) from animals infected at day 3 of life (left column), day 7 of life (middle column) or as adults (right column). Unpaired t test (parametric) and Mann-Whitney (nonparametric) statistics were used for 1A and 1C to compare groups by CD31 expression/day of life. 1B was analyzed by a 2-tailed paired t test (7 d and adult) or Wilcoxon’s matched-pairs signed rank test (3 d) (*P < 0.05, **P < 0.005, ***P < 0.0005, and ****P < 0.0001)

