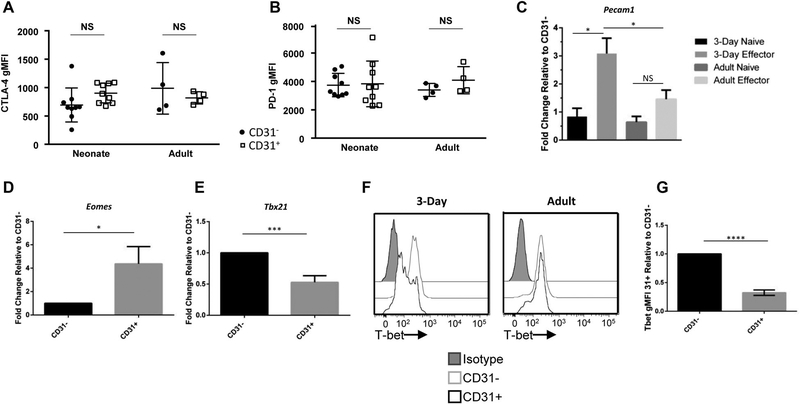
FIGURE 4. CD31+ and CD31− effector CTLs have similar expression of PD-1, CTLA-4, and FoxP3, but increased transcription of CD31 and a different master transcription factor profile.
Lungs were harvested from animals on day 9 post-influenza virus infection. Corresponding geometric MFI of effector (CD44+CD62L−) CD31+ or CD31− cells that express (A) CTLA-4 and (B) PD-1. Each dot represents a single animal. (n = 4–9 animals per group, 2 independent experiments). Viable naïve and effector CTLs were sorted from the lungs of animals infected on day 3 of life or as adults based on CD31 expression. (C) Transcriptional expression of Pecam1 relative to the groups own CD31− CTLs. (n = 8–10 animals per group, three independent experiments) (P < 0.05). Transcription of master transcription factors (D) Tbx21 and (E) Eomes in effector CTLs relative to their own CD31− CTLs were analyzed by RT-PCR. (n = 6–8 animals per group, three independent experiments). (F) Representative histograms of intranuclear T-bet staining performed on animals infected at day 3 of life (left) or as adults (right) at day 9 postinfection. (G) Corresponding geometric MFI of neonatal T-bet expression (n = 6 animals per group, three independent experiments). Unpaired t test (parametric) statistics were used to compare groups by CD31 expression/day of life (*P < 0.05, **P < 0.005, ***P < 0.0005, and ****P < 0.0001)

