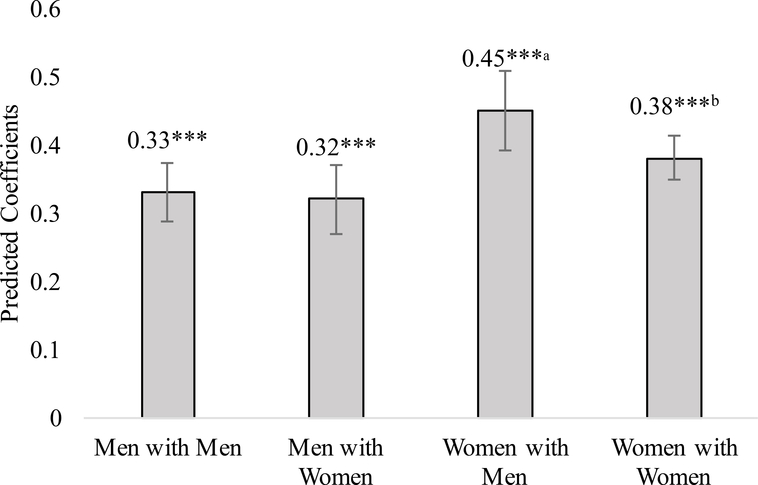
Figure 2.
Adjusted Predicted Effect of Spouse’s Distress on Respondent’s Distress by Group (Same-Day Results)
Note. Predicted effects are the predicted coefficients for each group from Table 2, Model 5. Statistical significance denotes overall significance of the association between partner and respondent psychological distress transmission
a. Based on a chi-square test of equality, the coefficient for Women with Men is statistically greater than the coefficients for Women with Women (p<.05), Men with Women (p<.001), and Men with Men (p<.001)
b. Based on a chi-square test of equality, the coefficient for Women with Women is statistically greater than the coefficients for Men with Women (p<.05)

