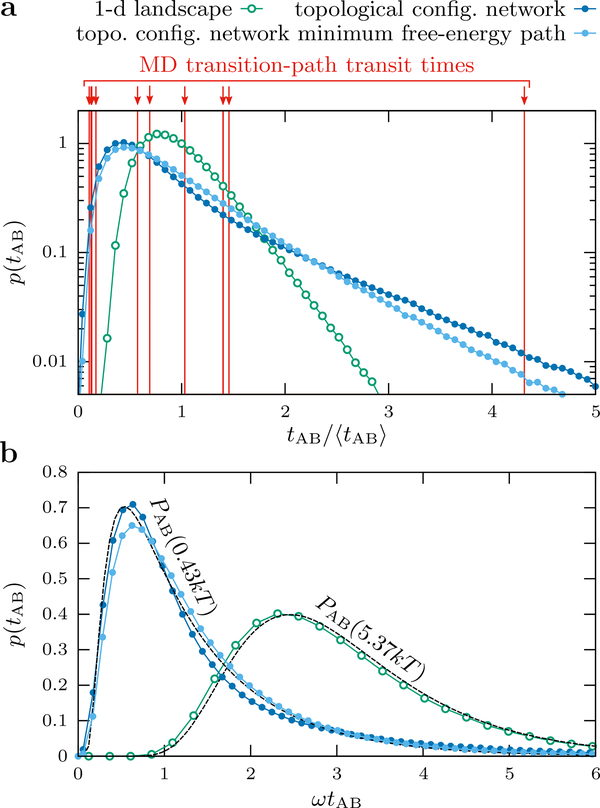
Figure 3:
Distributions of transition-path transit times, p(tAB), for the models of Ubiquitin folding shown in Figure 2. (a) The distributions calculated via kinetic Monte Carlo simulations of the 1-d native contacts landscape model, the topological configuration model, and the quasi-one-dimensional minimum free-energy path through the topological configuration network. To compare the shapes of the distributions, all transit times are scaled according to the mean transit time, ⟨tAB⟩, for each model. Also shown are the ten transit times observed in all-atom MD simulations. (b) The same three distributions were fit to the theoretical distribution for a harmonic barrier, , in order to estimate the decay constant, 𝜔-1 of the exponential tail. The transit-time distribution calculated from the empirical 1-d landscape agrees well with the theoretical distribution using the empirical barrier height, 5.37kT, while the distribution calculated from the topological configuration model can only be fit by if we set the shape parameter ΔF† equal to a much lower barrier height of 0.43kT.

