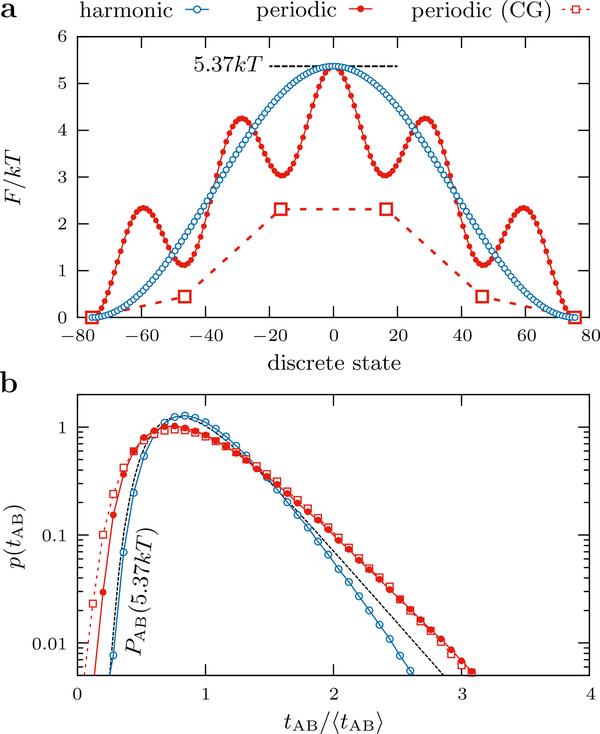
Figure 4:
Distributions of transition-path transit times for two one-dimensional toy landscapes. (a) The two toy free-energy landscapes, with a single harmonic barrier [blue empty circles; F(x) ∝ Acos(2πx/151)] and five intermediate barriers [red filled circles; F(x) ∝ Acos(2πx/151) + 2kT cos(10πx/151)], respectively. The maximum barrier height and number of discrete states were chosen to match the empirical 1-d landscape shown in Figure 2a for each toy landscape. Coarse-graining (CG) the intermediate-barrier landscape by calculating the mean first passage times between local free-energy minima results in the six-state model shown by red empty squares. (b) The transit-time distributions for the two toy landscapes, with all times scaled by the mean transit time, ⟨tAB⟩, for each model. The single-barrier landscape has a transit-time distribution that is narrower than the theoretical prediction, , for this barrier height (black dashed line), while the intermediate-barrier transit-time distribution and its coarse-grained approximation are significantly broader.

