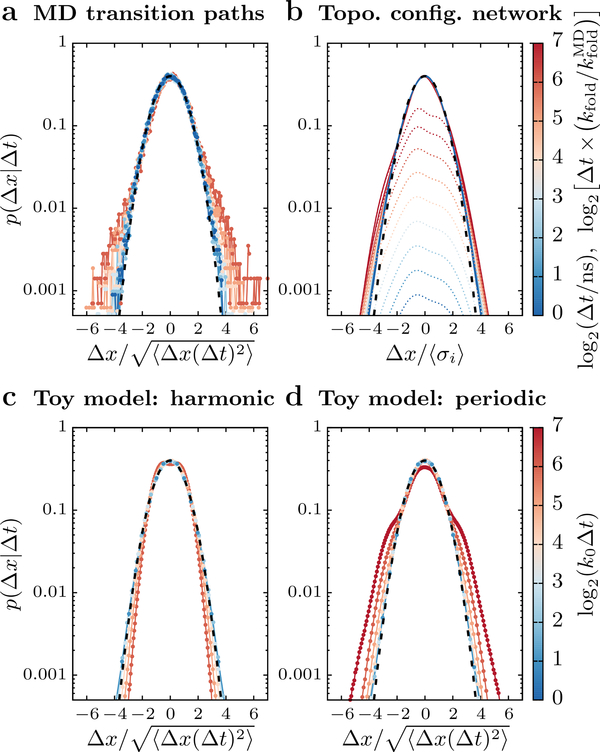
Figure 5:
Distributions of finite-time displacements on the 1-d native contacts order parameter, averaged over the transition-path ensemble. (a) The distribution of displacements Δx after a lag time Δt observed in all-atom MD transition paths. The distributions are centered, such that ⟨Δx⟩ = 0, and scaled by the root-mean-squared displacement at each lag time. The frequent small displacements are well described by a Gaussian distribution with a unit standard deviation (black dashed line); however, larger displacements are much more frequent than predicted by the tails of this Gaussian distribution. Colors correspond to the lag time, in units of nanoseconds, as shown by the scale bar on the right. (b) The predicted distribution of displacements corresponding to transitions between configurations in the topological configuration model (dotted lines) is broader than a Gaussian distribution fit to the transition-path-ensemble-averaged fluctuations within individual configurations, leading to similar fat-tailed behavior. The lag times are scaled by the slowest timescale of the MD simulations, , for comparison with panel a. (c–d) Distributions calculated from kinetic Monte Carlo simulations of transition paths on the two toy landscapes shown in Figure 4a. Only the intermediate-barrier landscape (panel d) reproduces the fat-tailed behavior observed in the MD simulations.

