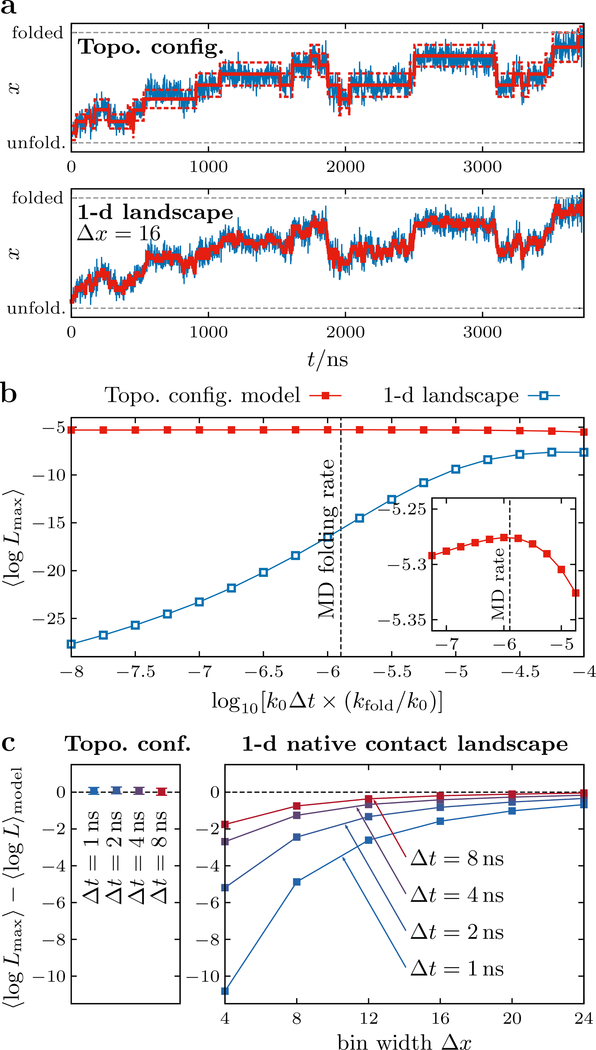
Figure 6:
Comparison of transition-path trajectories from atomistic MD simulations and trajectories generated by theoretical models. (a) The maximum-likelihood transition paths (red solid lines) through the discrete states of the topological configuration and 1-d landscape models given a representative MD transition-path trajectory, projected onto the number of native contacts, x (blue lines). For the topological configuration model, the expected fluctuations (i.e., the standard deviations of the Gaussian approximations in Figure 2b) within the most probable states are shown by red dashed lines. (b) The dependence of the per-frame log likelihood of the most probable sequence of states on the transition-matrix prefactor, k0. This rate is scaled by the folding rate predicted by the model, kfold, for comparison with the estimated MD folding rate, (black dashed line). The maximum of ⟨logLmax⟩ for the topological configuration model coincides with the MD folding rate (inset). (c) Comparison between the log likelihood of the most probable sequence of states and the expected log likelihood for each model, ⟨logL⟩model (see text). When fitting to the 1-d model, the agreement between these quantities depends strongly on the spatial coarse-graining, Δx, of the landscape and temporal averaging of the MD transition-path trajectories over time windows of width Δt. Error bars indicate the standard error of the mean.

