Fig. 3.
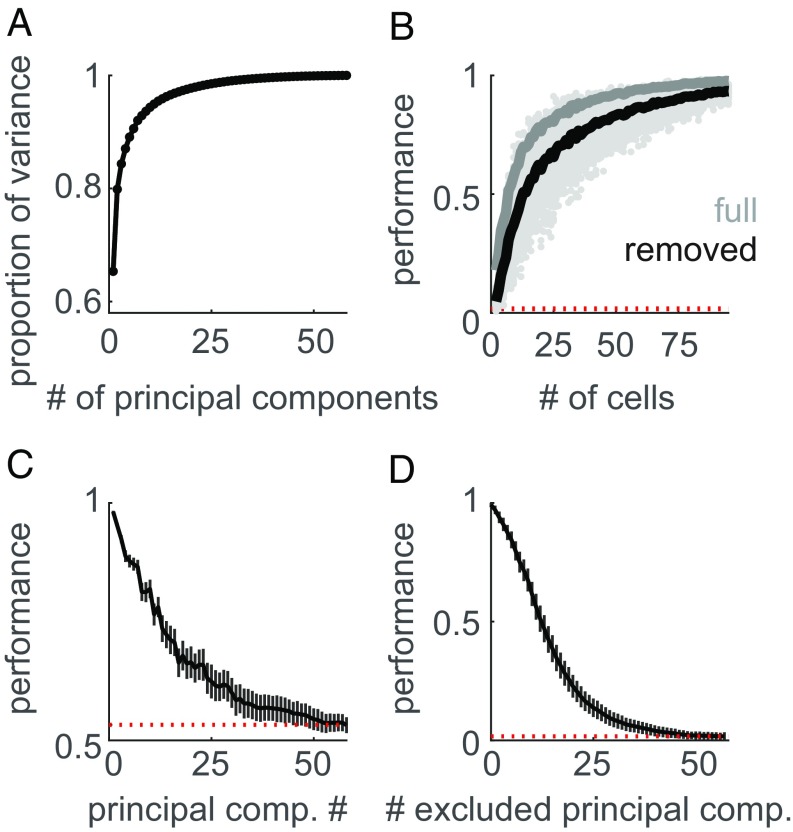
The cortical representation of texture is high-dimensional. (A) Cumulative scree plot (proportion of variance explained) for the PCA on the population response to texture. The bulk of the response variance is carried by the first few components. (B) Texture classification (as in Fig. 2) using the cortical population response with the full population response (gray line) and with the first principal component removed (black line). The red dotted line denotes chance performance. Classification performance is only slightly reduced when this first component is removed. (C) Average classification performance of each individual principal component when distinguishing between pairs of textures. Responses were above chance, even for components that explained only a small proportion of the total variance. Error bars represent the SD across texture pairs and shuffles of the training and test sets. (D) Classification performance based on firing rates projected onto a subset of principal components, built by excluding the n principal components in decreasing order of their eigenvalues (i.e., removing the largest components first). Error bars denote the SD across shuffles of the training and testing sets. Even when dozens of the high-variance principal components are removed from the response, texture classification is still above chance.

