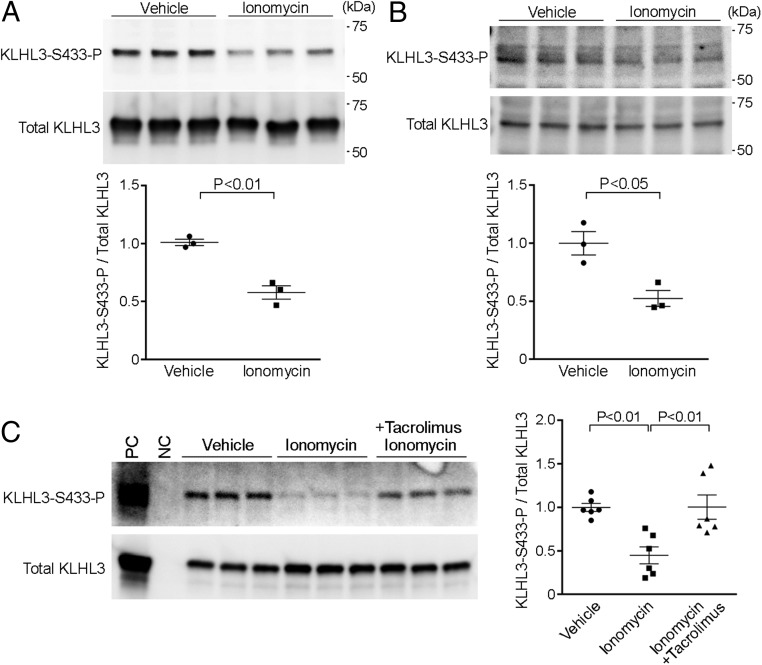
Fig. 1.
Calcineurin dephosphorylates KLHL3S433-P in HEK and DCT cells. (A) HEK cells expressing FLAG-KLHL3 were incubated with ionomycin for 5 min. Lysates of cells were analyzed by Western blotting using antibodies for KLHL3 phosphorylated at S433 (KLHL3S433-P) and for FLAG to detect total KLHL3. Blots show biological replicates. Dot-plot graphs show the results of quantification. Error bars in all graphs indicate SEM. (B) mDCT cells were incubated with ionomycin for 5 min. Changes in endogenous levels of KLHL3S433-P and total KLHL3 were analyzed by Western blotting. Dot-plot graphs show the results of quantification. (C) HEK cells expressing FLAG-KLHL3 was incubated with ionomycin in the presence or absence of tacrolimus, a calcineurin inhibitor. KLHL3S433-P and total KLHL3 levels were analyzed by Western blotting. Dot-plot graphs show the results of quantification. NC, negative control; PC, positive control (immunopurified KLHL3).

