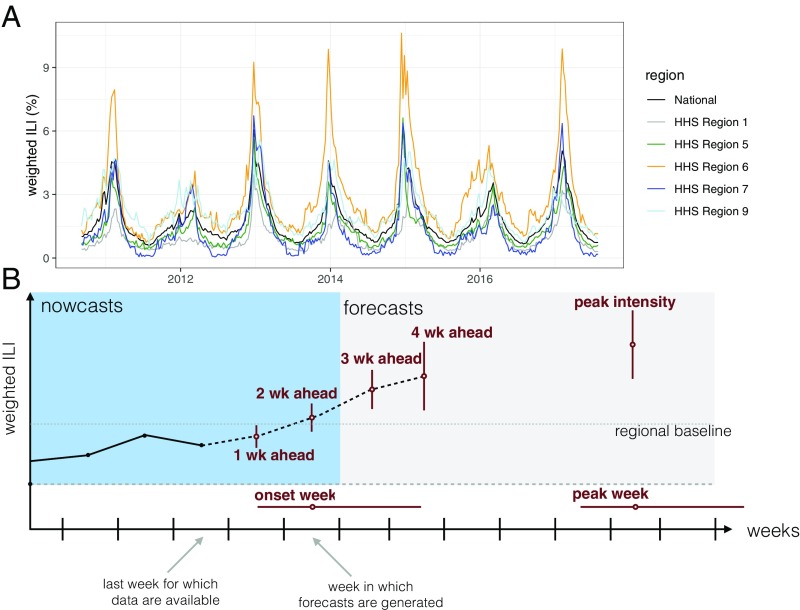
Fig. 1.
(A) wILI data downloaded from the CDC website from selected regions. The y axis shows the weighted percentage of doctor’s office visits in which a patient presents with ILI for each week from September 2010 through July 2017, which is the time period for which the models presented in this paper made seasonal forecasts. (B) A diagram showing the anatomy of a single forecast. The seven forecasting targets are illustrated with a point estimate (circle) and an interval (uncertainty bars). The five targets on the wILI scale are shown with uncertainty bars spanning the vertical wILI axis, while the two targets for a time-of-year outcome are illustrated with horizontal uncertainty bars along the temporal axis. The onset is defined relative to a region- and season-specific baseline wILI percentage defined by the CDC (19). Arrows illustrate the timeline for a typical forecast for the CDC FluSight challenge, assuming that forecasts are generated or submitted to the CDC using the most recent reported data. These data include the first reported observations of wILI% from 2 wk prior. Therefore, 1- and 2-wk-ahead forecasts are referred to as nowcasts, i.e., at or before the current time. Similarly, 3- and 4-wk-ahead forecasts are forecasts or estimates about events in the future.

