Fig. 1.
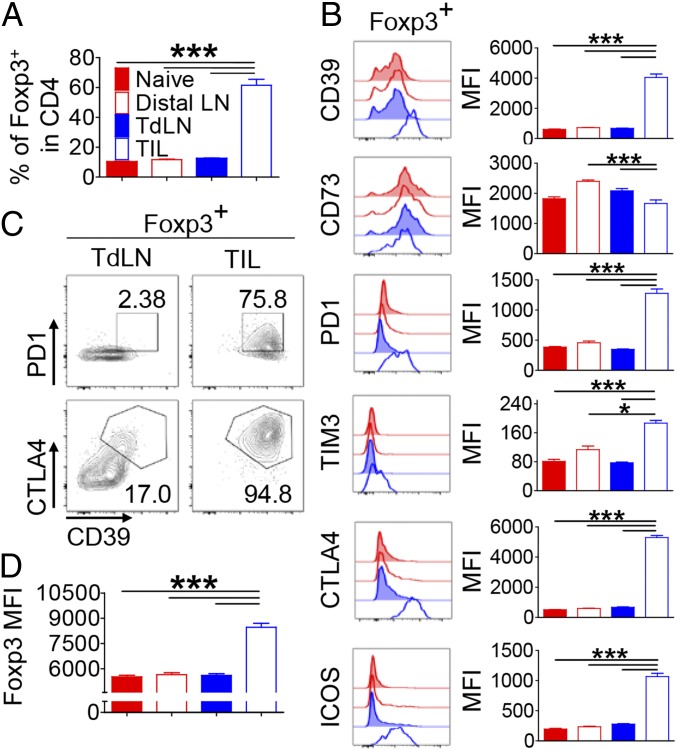
Tregs acquire a highly inhibitory phenotype in tumor tissue. Naïve and B16F10 s.c. tumor-bearing mice were analyzed at 15 d after inoculation for the phenotype of Tregs. CD4+Foxp3+ T cells in tumor-distal LN, TdLN, tumor tissue, and LN from naïve mice were analyzed by FACS. (A) The frequency of Foxp3+ cells in CD4+ T cells. (B) Histograms and geometric mean fluorescence intensity (MFI) of indicated proteins’ expression on Foxp3+ cells. (C) Coexpression of PD-1, CTLA-4, and CD39 on Foxp3+ cells from TdLN and tumor tissue. (D) Geometric MFI of Foxp3 in Tregs. The graphs show means ± SEM (*P < 0.05 and ***P < 0.001). Data are representative of two independent experiments (n = 6–7).

