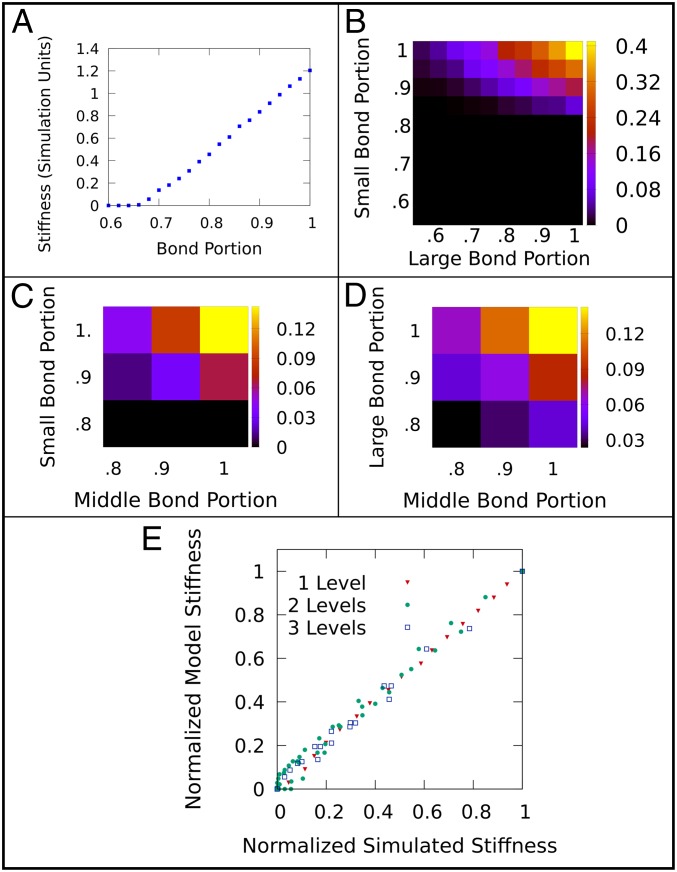
Fig. 2.
(A) Simulated stiffness plotted vs. bond portion for one length scale. (B) Heat map of simulated stiffness as a function of small and large bond portion for a two-level network. Stiffness is plotted in simulation units, as indicated in the key. (C) Heat map of simulated stiffness for a slice in bond portion space for three-level networks with full connectivity on the largest scale. Stiffness is plotted in simulation units, as indicated in the key. (D) Heat map of simulated stiffness for a slice in bond portion space for three-level networks with full connectivity on the smallest scale. Stiffness is plotted in simulation units, as indicated in the key. (E) Stiffness normalized by maximum stiffness for networks with one, two, and three levels of structure.

