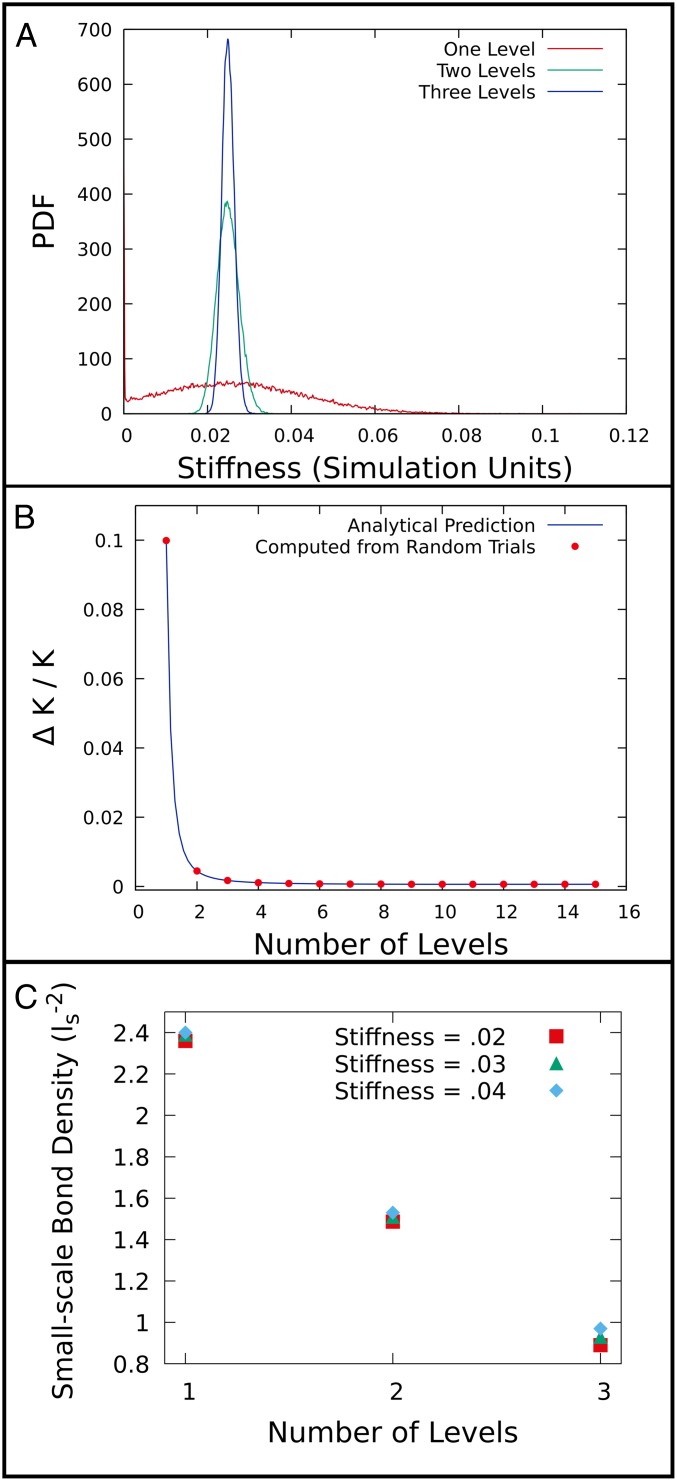
Fig. 3.
(A) Stiffness probability distribution functions (PDFs) estimated from histogram data for networks with one, two, and three levels of structural hierarchy. Points in 1D, 2D, and 3D bond portion with the same minute nominal stiffness were chosen, and Gaussian random variables were added to each bond portion. Note the spike in the PDF for the one-level network at zero stiffness. In this case, we consider a nominal stiffness of 0.025 and Gaussian random noise for each bond portion with zero mean and a SD of 0.005. Other cases are addressed in SI Appendix. (B) Relative error in stiffness vs. levels of hierarchy is plotted for , . As additional levels of structural hierarchy are added, the relative error in the tensile stiffness decreases precipitously at first, and the effect saturates at a certain number of levels. Provided the assumptions leading to Eq. 9 hold, our analytical theory and numerical approach are in close agreement (). Here, the product of excess bond portions is 0.001, and the noise has amplitude 0.0001 on each scale. (C) The number of all small-scale bonds in a network, divided by the area enclosed by the outer perimeter of the network, is shown vs. number of hierarchical levels for stiffness values of 0.02, 0.03, and 0.04, in units of stretching modulus over small-scale bond length. Networks were chosen to have the same bond portion on all three levels. In each case, increasing hierarchy leads to markedly lower density of small-scale bonds, attesting to the ability of hierarchy to confer both robustness and efficiency.

