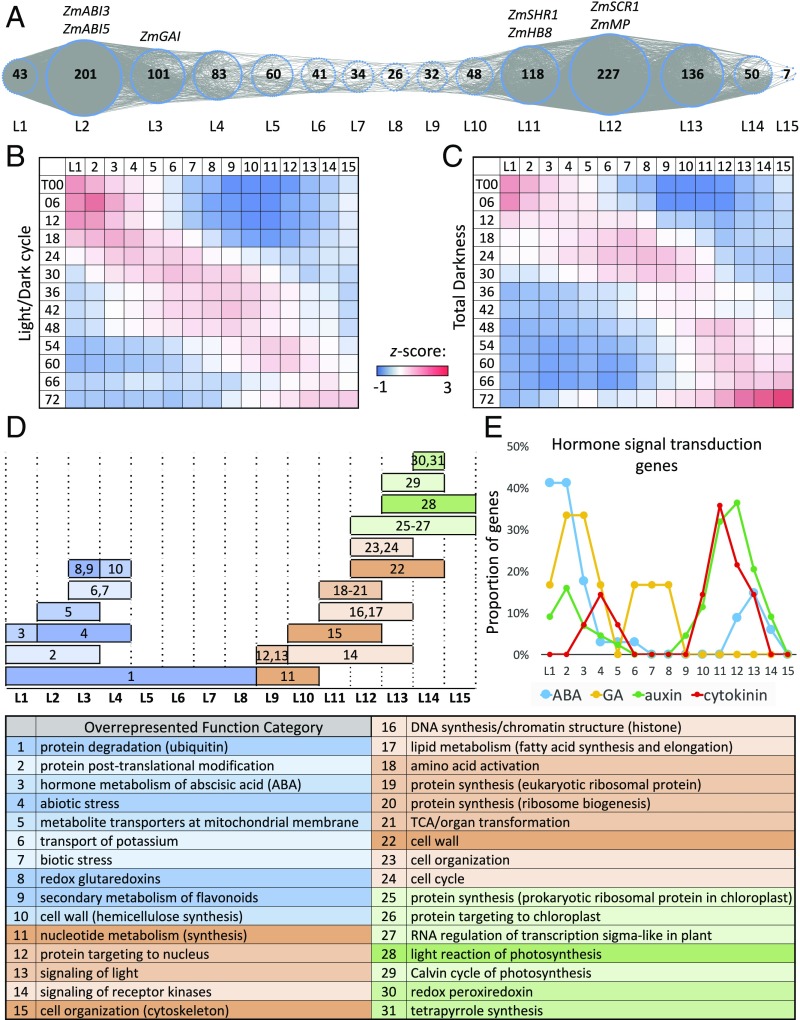
Fig. 2.
Light-independent TF TO-GCN and normalized gene expression profiles of TF genes at different levels. (A) The TO-GCN structure with TF genes as nodes (blue dotted circles). The number in a circle indicates the TF gene number at that level. (B and C) The heatmaps of average normalized RPKMs (z scores) at each time point of TF genes at each level of the TO-GCN under LD and TD, respectively. For each TF gene, the RPKMs over time points are normalized to z scores first. For each level, the z scores of all TFs are averaged in the heatmaps. (D) Overrepresented MapMan functions for coexpressed genes at each level. The numbers in the plot (Top) correspond to the index number of overrepresented functions listed in the table (Bottom). The blue, orange, and green colors represent the stage of germination, leaf development, and photosynthesis, respectively. (E) The proportions of genes in four hormone signal transduction pathways at each TO-GCN level (Dataset S2).

