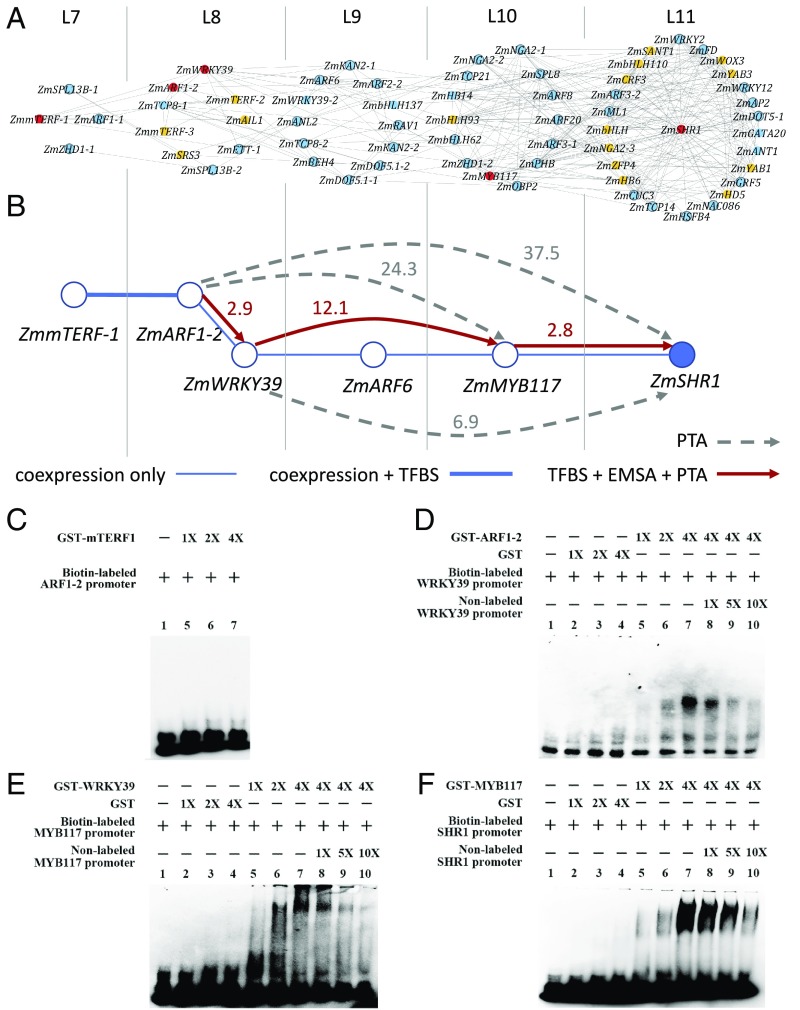
Fig. 3.
Inference and experimental validation of candidate upstream regulators of the ZmSHR1 gene in maize leaf development. (A) The first- to fourth-order candidate upstream regulators of ZmSHR1 inferred from the light-independent TF TO-GCN (SI Appendix, Table S3). ZmSHR1 is placed at the center of level 11 of this subnetwork. TFs without known TFBS are shown in orange. Known TFBSs of TFs (blue color) are used to check the presence of their mapped sites in the promoter sequences of their candidate downstream genes. The TFs in the predicted regulatory pathway with TFBS support are shown in red and are selected for experimental validation. (B) The upstream regulatory network of ZmSHR1 targeted for experimental validation. The number beside a directed solid line or dashed line with an arrow represents the fold increase in the expression level of the potential direct or indirect target gene in the PTA experiment. Red lines: the presence of the TFBS in the promoter of the target gene (indicated by arrows) and validated by both PTA and EMSA. Dashed gray lines: with PTA support but no TFBS found in the promoter. (C–F) EMSA experiments testing interactions between predicted TFBSs in the promoters of putative targets and GST-ZmmTERF1 (C), GST-ZmARF1-2 (D), GST-ZmWRKY39 (E), or GST-ZmMYB117 (F). In each case: lane 1: biotin-labeled probe alone; lanes 2 to 4: with increasing amounts of purified GST (except for C); lanes 5 to 7: with increasing amounts of GST-TF; and lanes 8 to 10: with increasing amounts of the nonlabeled probe (except for C).

