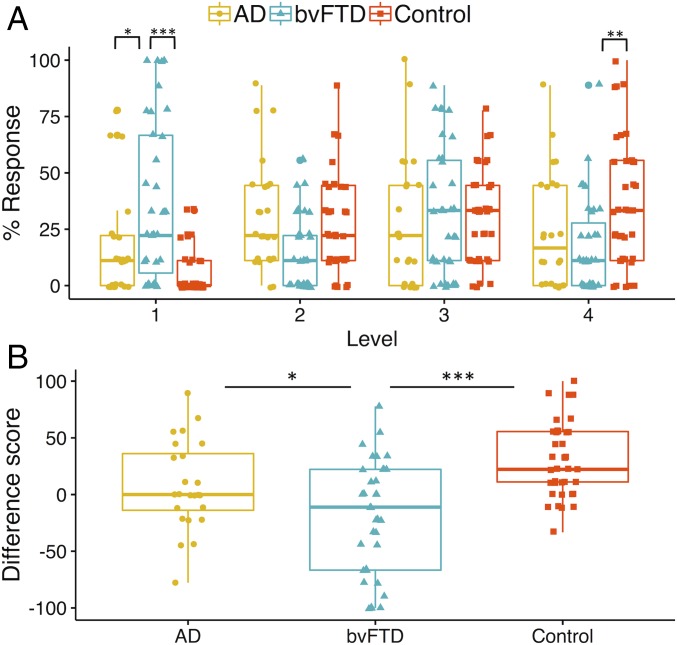
Fig. 1.
(A) Overall proportion of mind wandering scores across participant groups. Percentage responses across the mind wandering continuum. The asterisks show the main results of group differences at Level 1 and Level 4. Level 1 responses represent stimulus-bound thoughts; Level 4 responses denote fully fledged instances of mind wandering. (B) Average mind wandering index scores. Mind wandering index (i.e., percentage difference in Level 4 minus Level 1 responses). Higher scores reflect an increased propensity to engage in mind wandering as opposed to stimulus-bound thought with lower scores reflecting a tendency toward stimulus-bound thought. *P < 0.05; **P < 0.01; ***P < 0.001.

