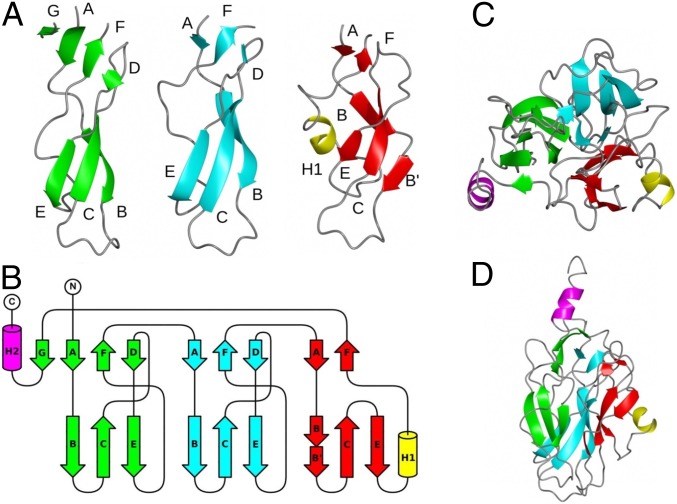
Fig. 2.
Structure and topology of the C-terminal domain of GNIP1Aa. (A) Ribbon diagrams for subdomains 1 (green), 2 (cyan), and 3 (red). The apical loops are located between strands B and C. The additional helix H1 in subdomain 3 is shown in yellow. The C-terminal α-helix H2 is omitted for clarity. (B) Topology diagram for the C-terminal domain. Structural elements are colored according to A. The C-terminal helix H2 is colored in magenta. (C) Arrangement of subdomains in the C-terminal domain. A view along the threefold pseudosymmetry axis, from the MACPF domain’s side. (D) View perpendicular to C.

