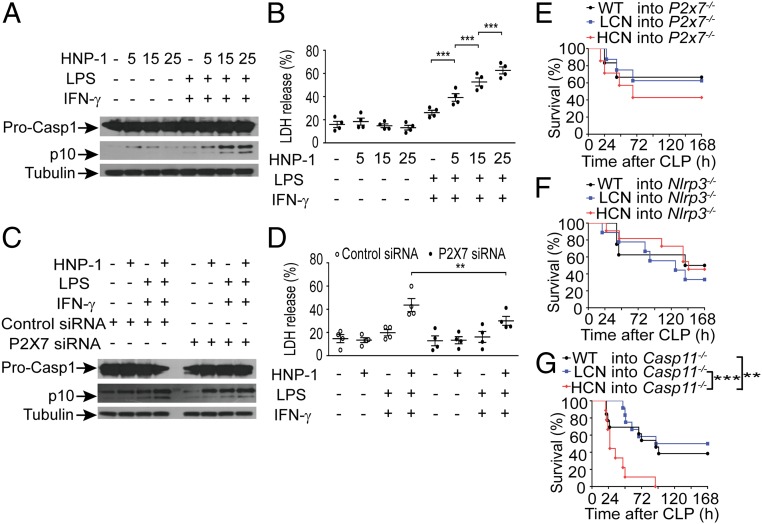
Fig. 4.
HNP-1 induces endothelial cell pyroptosis through P2X7-mediating canonical caspase-1 activation. (A) Representative Western blot analysis of caspase-1 precursor (Pro-CASP1) and mature caspase-1 (p10) following stimulation with different concentrations of HNP-1 (0 μg/mL, 5 μg/mL, 15 μg/mL, 25 μg/mL) in MLMECs that were already primed with LPS (1 μg/mL) and IFN-γ (100 ng/mL). One representative of four independent experiments is shown. α-Tubulin served as a loading control. See also SI Appendix, Fig. S16 for uncropped images of immunoblots. (B) Cell toxicity (measured by LDH release into the medium) in response to different concentrations of HNP-1–stimulated MLMECs that were already primed with LPS and IFN-γ (n = 4). ***P < 0.001, one-way ANOVA with Bonferroni posttests. (C) Representative Western blot analysis of Pro-CASP1 and p10 caspase-1 following HNP-1 (25 μg/mL) stimulation in P2X7 siRNA and control siRNA-transfected MLMECs that were already primed with LPS and IFN-γ. One representative of four independent experiments is shown. α-Tubulin served as a loading control. See also SI Appendix, Fig. S16 for uncropped images of immunoblots. (D) Cell toxicity (measured by LDH release into the medium) following HNP-1 (25 μg/mL) stimulation in P2X7 siRNA and control siRNA-transfected MLMECs that were already primed with LPS and IFN-γ (n = 4). **P = 0.004, one-way ANOVA with Bonferroni posttests. (E–G) Survival over time of lethally irradiated P2x7−/− mice (E), NLRP3−/− mice (F), and caspase-11−/− mice (G) that were reconstituted with BM from WT mice, mice with LCN of DEFA1/DEFA3, and mice with HCN of DEFA1/DEFA3 and that were subsequently subjected to CLP. In E, n = 6 for mice reconstituted with BM from WT mice, n = 8 for mice reconstituted with BM from mice carrying LCN of DEFA1/DEFA3, and n = 7 for mice reconstituted with BM from mice carrying HCN of DEFA1/DEFA3. In F, n = 8 for mice reconstituted with BM from WT mice, n = 9 for mice reconstituted with BM from mice carrying LCN of DEFA1/DEFA3, and n = 11 for mice reconstituted with BM from mice carrying HCN of DEFA1/DEFA3. In G, n = 13 for mice reconstituted with BM from WT mice, n = 12 for mice reconstituted with BM from mice carrying LCN of DEFA1/DEFA3, and n = 9 for mice reconstituted with BM from mice carrying HCN of DEFA1/DEFA3. **P = 0.009, ***P < 0.001, log-rank test. In B and D, data are presented as dot plots with horizontal bars representing means ± SEM.

