Fig. 5.
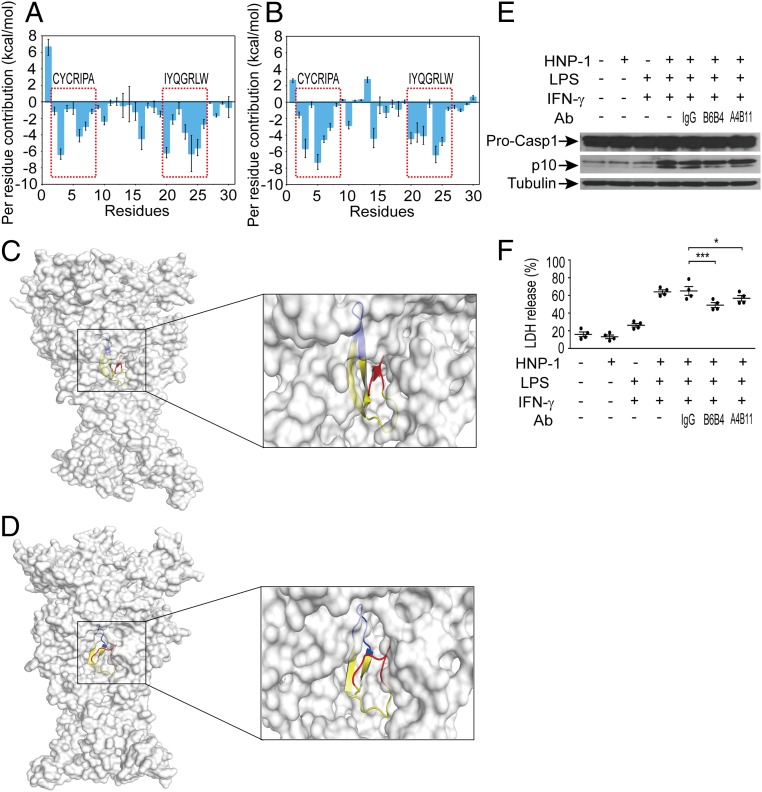
Monoclonal antibodies block the interaction between HNP-1 and P2X7 in vitro. (A and B) Per residue contributors to the binding free energy of HNP-1 with hP2X7 (A) or mP2X7 (B). (C and D) Structure analysis of the last snapshot of the HNP-1/hP2X7 complex (C) and HNP-1/mP2X7 complex (D) from MD simulations. The molecular surface views are presented. The three monomers of hP2X7 or mP2X7 are colored in gray. The CYCRIPA motif, IYQGRLW motif and other motifs of HNP-1 are colored in red, blue, and yellow, respectively. (E) Representative Western blot analysis of Pro-CASP1 and p10 caspase-1 following HNP-1 (25 μg/mL) combined with monoclonal antibody (B6B4 or A4B11) or control IgG treatment in MLMECs that were already primed by LPS (1 μg/mL) and IFN-γ (100 ng/mL). One representative of four independent experiments is shown. α-Tubulin served as a loading control. See also SI Appendix, Fig. S16 for uncropped images of immunoblots. (F) Cell toxicity (measured by LDH release into the medium) in HNP-1 combined with monoclonal antibody (B6B4 or A4B11) or control IgG-treated MLMECs that were already primed with LPS and IFN-γ (n = 4). Data are presented as dot plots with horizontal bars representing means ± SEM. *P = 0.028, ***P < 0.001, one-way ANOVA with Bonferroni posttests.

