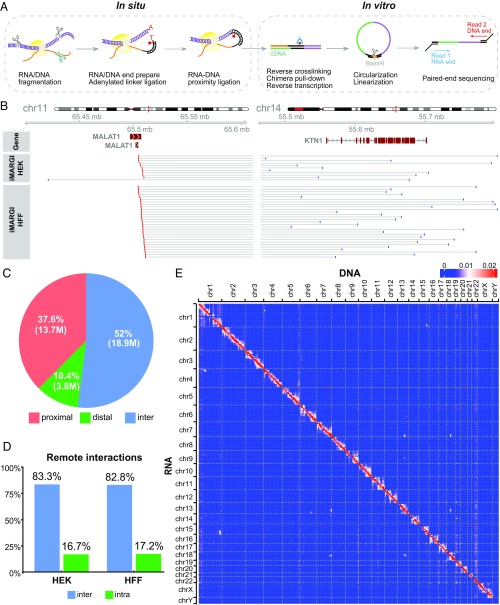
Fig. 1.
Overview of iMARGI method and data. (A) Schematic view of iMARGI experimental procedure. (B) An example of interchromosomal read pairs (horizonal lines), where the RNA ends (red bars) were mapped to the MALAT1 gene on chromosomal 11, and the DNA ends (blue bars) were mapped to chromosome 14 near the KTN1 gene (blue bars). (C) Proportions of proximal, distal, and interchromosomal read pairs in a collection of valid RNA–DNA interaction read pairs. M: million read pairs. (D) Ratios of inter- and intrachromosomal read pairs in HEK and HFF cells after removal of proximal read pairs. (E) Heatmap of an RNA–DNA interaction matrix in HEK cells. The numbers of iMARGI read pairs are plotted with respect to the mapped positions of the RNA end (row) and the DNA end (column) from small (blue) to large (red) scale, normalized in each row.

