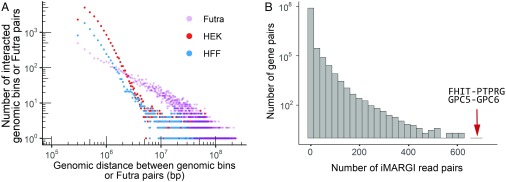
Fig. 2.
Summary of iMARGI data. (A) The number of genomic bin pairs with 10 or more iMARGI read pairs (y axis) is plotted against the genomic distance between the pair of genomic bins (x axis) in HEK cells (red circles) and HFF cells (blue circles). For comparison, the number of fusion transcript-contributing RNA (Futra) pairs (y axis) derived from 9,966 cancer samples is plotted against the genomic distance (x axis) between the genes involved in the fusion (purple circles). (B) Histogram of the number of iMARGI read pairs of every gene pair (x axis) across all of the intrachromosomal gene pairs with genomic distance >200 kb in HEK cells. Arrow: the gene pairs with the largest and the second largest number of iMARGI read pairs.

