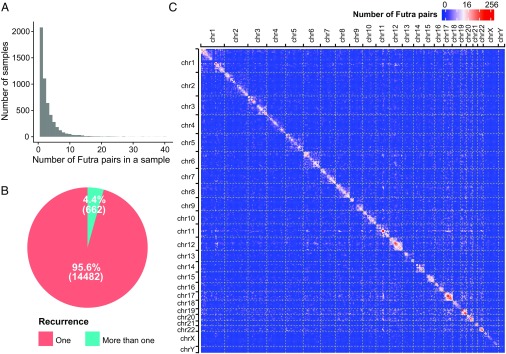
Fig. 3.
Overview of the 15,144 Futra pairs derived from 33 cancer types. (A) Distribution of the number of detected Futra pairs in each sample across the 9,966 cancer samples. (B) Pie chart of the numbers of Futra pairs that appeared in only one cancer sample (nonrecurring Futra pairs, red) and in multiple cancer samples (recurring Futra pairs, green). (C) The genomic distribution of Futra pairs. Genomic coordinates of all chromosomes are ordered on rows and columns. The numbers of Futra pairs of corresponding genomic positions are shown in a blue (small) to red (large) color scheme. Bin size: 10 Mb.

