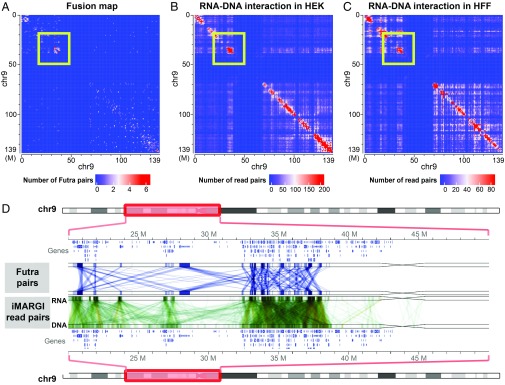
Fig. 4.
Comparison of Futra pairs and iMARGI read pairs. (A) Distribution of intrachromosomal Futra pairs on chromosome 9. Genomic coordinates are plotted from top to bottom (rows) and from left to right (columns). (B and C) RNA–DNA interaction matrices in HEK cells (B) and HFF cells (C). The numbers of iMARGI read pairs are plotted with respect to the mapped positions of the RNA end (rows) and the DNA end (columns) on chromosome 9 from small (blue) to large (red) scale. (D) Detailed view of a 30-Mb region (yellow boxes in A–C). This genomic region and the contained genes are plotted twice in the top and the bottom lanes. In the track of Futra pairs, each blue line linking a gene from the top lane to a gene at the bottom indicates a Futra pair. In the track of iMARGI read pairs in HEK cells, each green line indicates an iMARGI read pair with the RNA end mapped to the genomic position in the top lane and the DNA end mapped to the bottom lane.

